
Reversals are critical situations that happen in the financial market all the time. That’s because currency pairs usually rise and fall regularly. For example, while the US dollar retreated in 2020 during the Covid-19 pandemic, it managed to bounce back in 2021. The same trend is seen in the long-term and short-term. In this article, we will look at some of the top three ways to identify a reversal in the forex market. These strategies can also be used in other assets like stocks and commodities.
Using chart patterns to identify reversals
There are two main types of chart patterns in the financial market. First, there are continuation patterns, which signal that an existing trend will continue. Examples of these patterns are bullish and bearish flags, bearish and bullish pennants, cup and handle, and ascending and falling triangles. When you see them, it increases the possibility that the existing trend will go on.
Second, there are reversal patterns, which mean that an asset will ultimately start a new trend. When they happen, they send signs that a trend will reverse. Examples of reversal patterns are double and triple top and bottom patterns, head and shoulder, and rising and falling wedges.
A double-top pattern happens when a currency pair is in a bullish trend. It then hits a strong resistance (say 1.1350) and then starts a new bearish trend. As the pair drops and finds another support (say 1.1300) and then rises again and retests the first resistance. In this case, if there are not enough bulls available to push the pair above the resistance at 1.1350, it will send signals that a new bearish trend is about to start.
This is what happened in the EURUSD chart below. As you can see, the pair was in a bullish trend between March 2020 and January 2021. In the coming months, the pair managed to form a double-top pattern that is shown in pink. The chin of this pattern is at 1.1700 and is shown in black. Ultimately, the pair managed to break out lower, signaling that a reversal had formed.
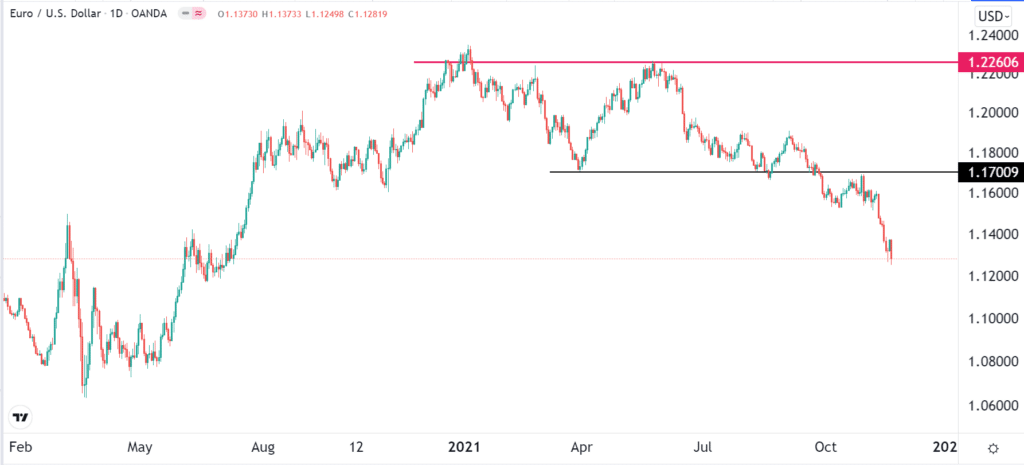
It is worth noting that the pair retests the black line after it makes a bearish breakout. This pattern is usually known as a break and retest and is a confirmation that a breakout has happened.
Another example of this is shown in the USDJPY chart below. As you can see, the pair was in a bullish trend when it hit resistance at 114.71.
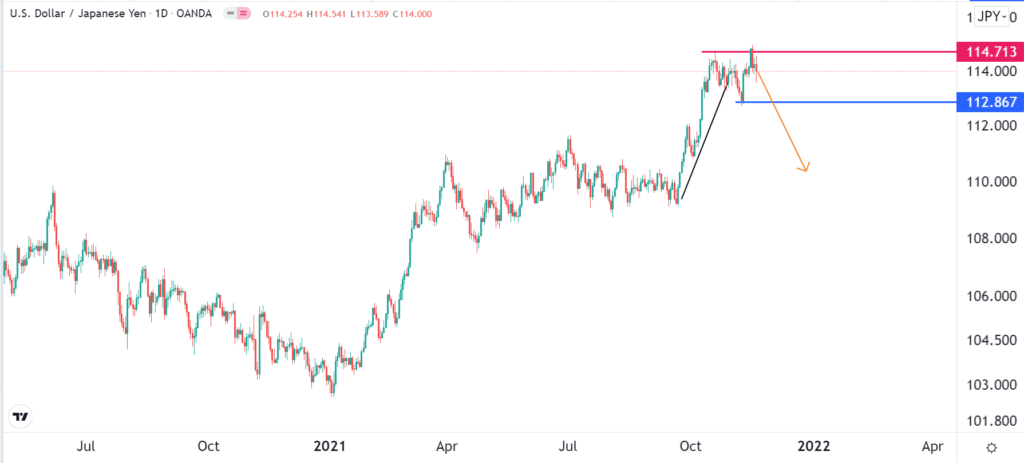
The chin of this double-top pattern is at 112.86. Therefore, while a reversal has not happened yet, there is a high possibility that the pair will break out in the near term.
Using candlestick patterns
Another price action strategy is to use candlestick patterns. These are patterns that when looked at closely will give you some clues about whether a currency pair will continue with its existing trend or whether it will reverse.
These candlestick patterns have been used in the financial market for decades. While they are useful patterns, in my experience, I believe that they tend to be inaccurate compared to the chart patterns mentioned above. Therefore, forex traders should use them cautiously. Most importantly, traders need to combine them with other tools like indicators.
There are many candlestick patterns. Continuation patterns include upside and downside tasuki gap, thrashing lines, black white crows, and falling three methods. Reversal candlestick patterns are hammer, bullish, and bearish engulfing patterns, bullish and bearish harami, tower top and tower bottom, shooting star, and doji.
Using these candlestick patterns is a relatively easy thing to do. For one, all you need to do is to look at a chart and try to identify a pattern that is forming. If you identify a reversal pattern like the doji or hammer, it will increase the possibility of a reversal happening.
An example of this is shown in the four-hour chart below.
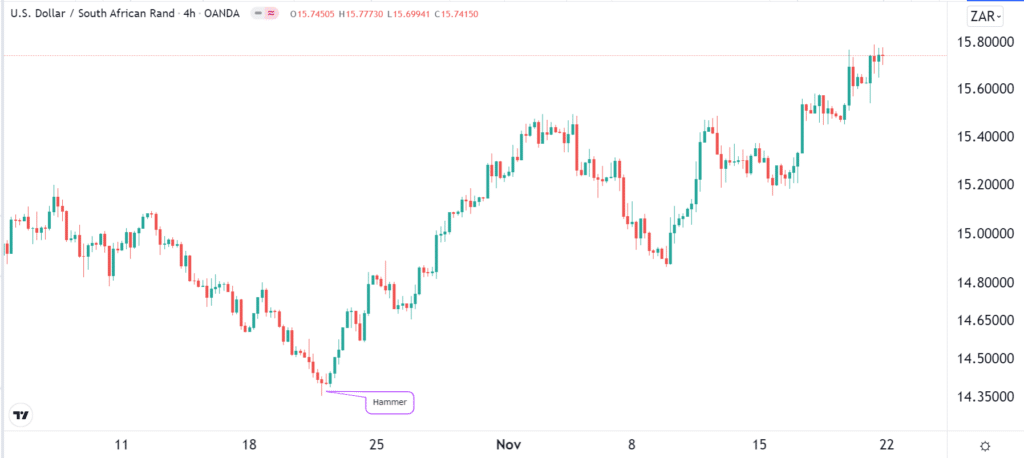
The chart shows that the USDZAR was in an overall bearish trend for a while. This trend ended when the pair formed a small hammer pattern.
Using technical indicators
Another way of identifying reversals in forex trading is to use technical indicators. These are tools created using mathematical calculations to guide traders in the market. There are several types of indicators. For example, there are trend indicators like Moving Averages, Bollinger Bands, and envelopes. There are momentum oscillators like Stochastics, Relative Strength Index (RSI), and Relative Vigor Index (RVI). Additionally, there are volume indicators like the Money Flow Index (MFI) and accumulation and distribution.
When used well, these indicators can help you identify reversals in the forex market. For example, you can predict a reversal when the Relative Strength Index moves to an overbought or oversold level. Similarly, you can predict that a reversal will happen when these oscillators form a bullish or bearish divergence pattern.
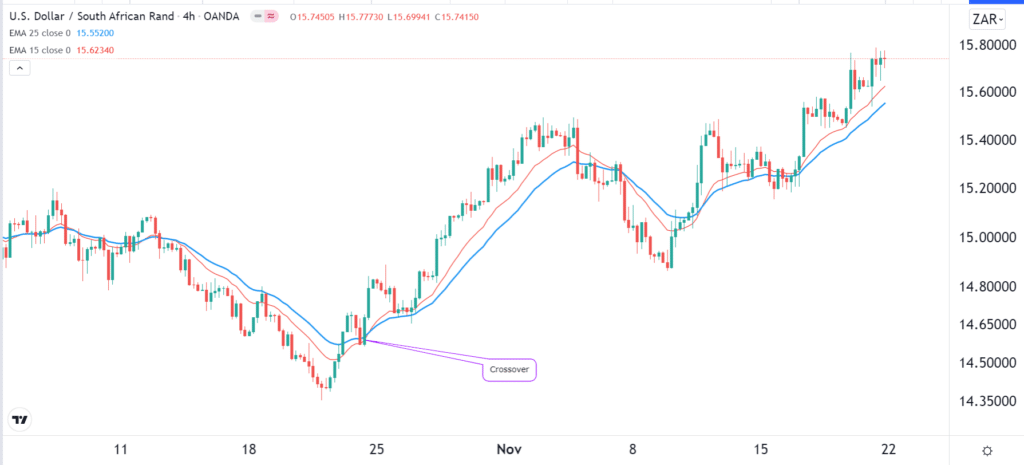
One of the most popular strategies for identifying reversals is to use double or triple Moving Averages. This is where you combine short and longer Moving Averages in a chart. In this case, a reversal will happen when the two Moving Averages make a crossover.
In the example below, we see that the USDZAR made a reversal when the 25-day and 15-day Moving Averages made a crossover. In this case, the bullish trend will continue as long as the price is above the two Moving Averages.
A popular way among long-term investors is known as a death cross or a golden cross. It is similar to the one shown above, but it uses the 50-day and 200-day Moving Averages.
Summary
Identifying reversals is an essential and popular method of finding trading opportunities. This article has looked at the four most popular strategies you can use to spot these reversal points. None of them are perfect. But if you use them well, you will increase the possibility of exploiting good reversals and riding the new trend that emerges.


Leave a Reply