Relative Strength Index is one of the best forex indicators leveraged by traders in manual trading as well as automated forex trading. As a forex-charting tool, the indicator is often used to measure momentum magnitude in technical analysis of stocks, currencies, commodities, among other securities.
Understanding RSI Indicator
The RSI indicator stands out as an essential forex trading instrument on the fact that it simplifies the process of ascertaining oversold and overbought conditions in price action analysis. While supplementing chart patterns, the indicator appears as an oscillator moving between two extremes. Likewise, its readings range from zero to 100.
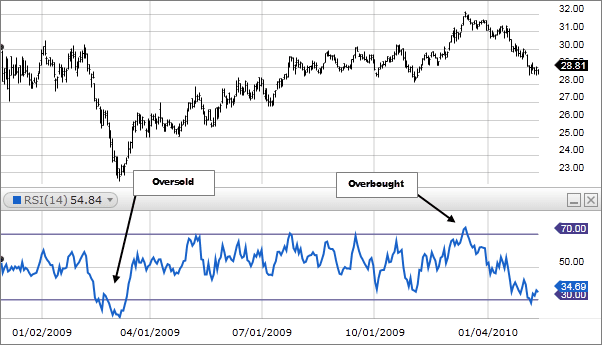
Whenever the values of the RSI indicator are above 70, the same is interpreted as overbought conditions in the market. In this case, there is usually a high probability of price reversing. Similarly, whenever the indicator is below the 30, the same indicates oversold or undervalued conditions.
RSI is a crucial money-making hack in the forex market as it also forms chart patterns that, at times, might be difficult to detect in normal price charts. Similarly, it is the best indicator for automated trading as it allows traders to identify double tops and double bottoms as well as trend lines. It is also an ideal indicator for detecting support and resistance levels.
RSI Trading Strategies
RSI indicator is a commonly used indicator in supplementing various trading strategies. Traders leverage the indicator in hedging, scalping as well as arbitrage trading as it makes it possible to detect ideal entry and exit points.
Likewise, the indicator finds excellent use in news trading and trend trading, given its ability to detect oversold and overbought conditions during wild price swings.
RSI OBOS Levels
A common RSI Strategy involves studying RSI indicator levels as price oscillates up and down. While using a forex robot or trading manually, traders track the RSI levels to detect overbought and oversold conditions.
Whenever the RSI level is less than 30, the same is interpreted as oversold conditions. What this implies is that price has run its course lower and might eventually reverse upwards. Once a reversal is confirmed, a buy can be placed.
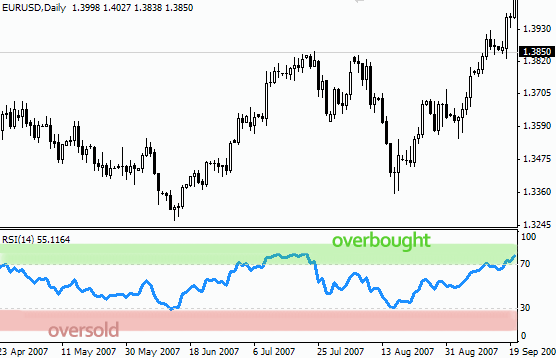
Similarly, whenever the RSI is more than 70, the same might imply overbought conditions, which could see price declining on the lack of buyers to push the price higher. In this case, one can place a sell trade
The 50 level on the RSI indicator acts as the midline separating bullish and bearish territories. Likewise, it acts as a useful charting tool for trend detection. Whenever the RSI reading is above 50, the same is interpreted as uptrend and downtrend whenever the reading is below 50.
RSI Crossover Strategy
The RSI indicator can also be used in crossover trading. With this RSI Strategy, traders use two RSI’s while carrying out technical analysis. A short period RSI, says 5-period RSI might come into use, applied over a more prolonged default RSI says RSI 14. The use of two RSIs makes it possible to ascertain crossovers as well as overbought and oversold conditions.
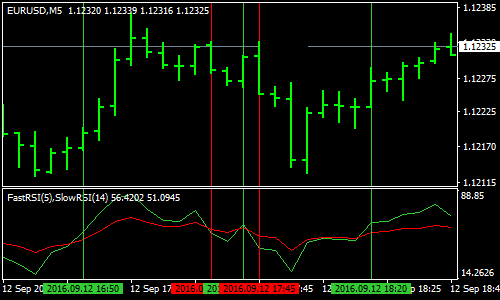
The shorter RSI 5 tends to be more active to price changes as it moves faster than the RSI 14 indicator, ideal for detecting reversals whenever crossover happens. Conversely, whenever the RSI 5 crosses above the RSI 14 from below, the same can be interpreted as price reversal and that the recent price might continue edging higher. In this case, a trader can trigger a buy position.
Whenever the RSI 5 indicator crosses the RSI 14 from above and continues to edge lower, the same might be interpreted that the price is about to keep edging lower. In this case, a trader can open a sell position.
RSI Trend lines
While engaging in position trading, RSI can help in detecting ideal entry and exit points while focusing on trend lines. To detect possible trend lines, it is essential to connect tops and bottoms on the RSI chart by connecting three or more points as the RSI indicator oscillates up and down.
In case of a downtrend line, it would be wise to connect three or more points on the RSI trend line. Price action that results in the breaking of the trend line might as well indicate potential price continuation or a reversal if the price was bouncing back from the RSI trend line.
RSI Divergence Strategy
While engaging in manual or algorithmic FX trading, you might detect periods when price forms a higher high while at the same time, the RSI line decreases or forms a lower high. It is often referred to as divergence.
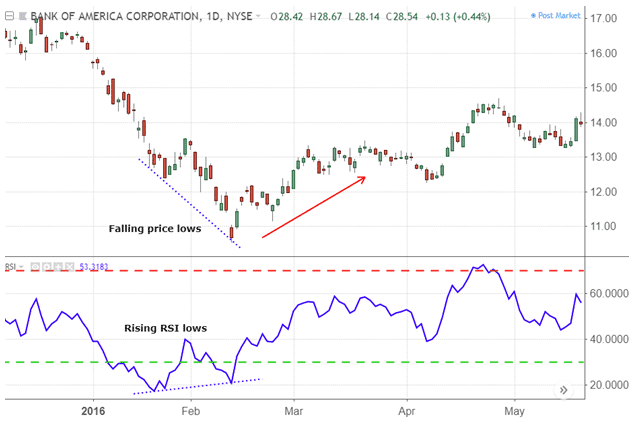
RSI divergence tends to form at the top of a bullish market, signaling an imminent pattern reversal. Likewise, when the price is moving higher while the RSI is moving down, the same might be an early warning sign that price is losing upward momentum and might reverse soon in what is referred to as RSI bearish divergence.
Similarly, RSI bullish divergence forms when price or an underlying security form lower low while RSI forms a higher low. If this was to happen, then a trader should be on the lookout for a potential change in the direction of price action.
Bottom line
RSI is a widely used indicator given its ability to detect overbought and oversold conditions. Similarly, the indicator helps traders identify key price levels of support and resistance, as well as the underlying trend. Conversely, RSI strategies can complement any trading strategy.


Leave a Reply