Candlesticks are the most popular chart in the Forex industry, but it comes with much responsibility. Candlesticks chart are indeed easy to use, but at the same time, it provides useful information and many signals depending on the type of candles we are dealing in the graphs.
Be ready to discover some of the most popular and best strategies with candlestick charts.
Also, our Candlestick Cheat Sheet will help to use candlestick patterns while trading.
Bullish Candlestick Patterns
There are many candle sticks that in the right pattern, may signal bullish movements.
Three samples are the bullish Harami, the hammer candle, and the bullish engulfing.
Bullish Harami
The bullish Harami is a red candle which is followed by a green inside candle. That means that the second candle develops itself inside the previous candle’s lows and top prices.
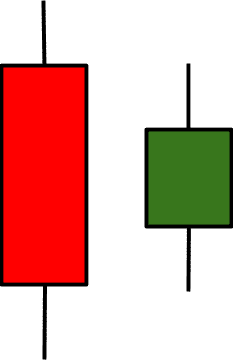
It represents hesitation in the market, and it could signal that a downtrend may comes to an end. So, if it is a red candle with a positive candle following it could be a change in the negative direction to an upside break.
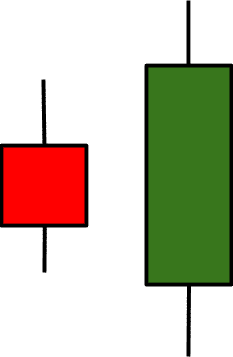
Bullish Engulfing
The bullish engulfing pattern is a red candle followed by a bigger green candle when the red is developed inside the greens top and low prices. It suggests a continuation in the upside.
Hammer Candle
The hammer candle shows a change of the odds when sellers push the market to new lows, but then, the buyers counterattack and take the pair all the way back to the upside. A hammer candle always has opening and closing prices at the upper half of the candle. It means a rejection of the downside and possible intensification of the upside. It could be a red or green candle.

Bearish Candlestick Patterns
As you may know it, Forex is a two-direction market. You can make money going long or betting short. But also, you are always going long in one currency neither you are buying or selling a pair. So, as there are bullish candlestick chart patterns, the same happens for bearish patterns. Let’s see some samples.
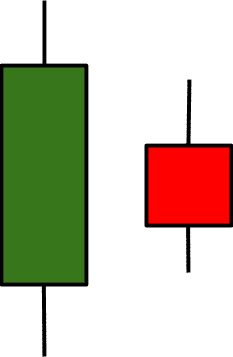
Bearish Harami
The bearish Harami pattern is a green candle followed by a smaller red candle which is developed inside the top and low prices of the previous candle. It may represent the end of an uptrend and traders usually go short after a bearish Harami.
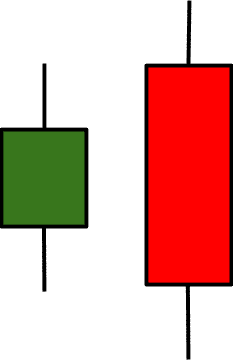
Bearish Engulfing
The bearish engulfing sequence is a green candle with a red candle which is significantly larger than its previous one with highs and lows outside the last green candle. It represents a substantial change in market sentiment and a possible downside breakout.
Inverted Hammer
The inverted hammer is a candle is a formation that shows buyers pushing the market to highs, but then sellers reacting and selling stronger to send the price down again where opening and closing prices should be at the lower half of the candle. It is also called a shooting star. It represents a rejection of the upside and downside continuation. Note that it could be a green or red candlestick.

More Candlestick Chart Patterns
There are many candlestick formations that you can use to make money either in a bullish or bearish markets. The only you should know it is to identify candles, what information it is showing, and how to use it.
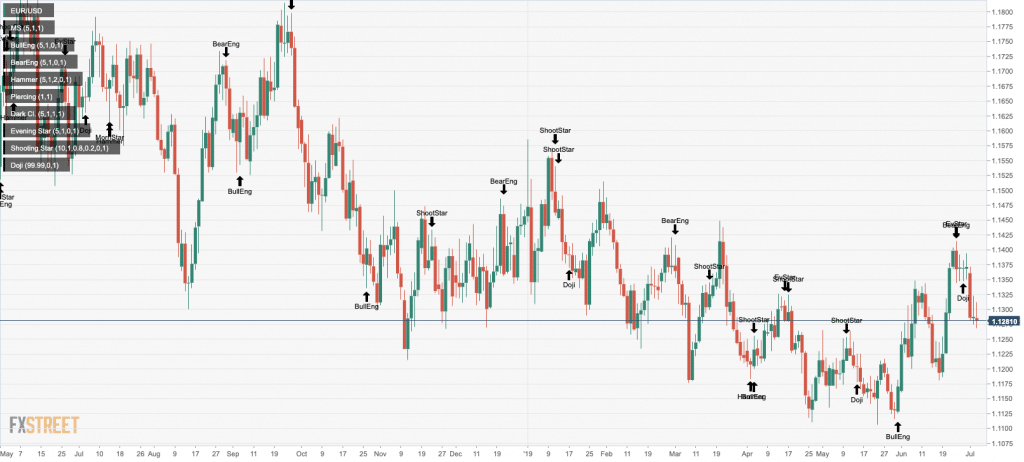
The possibilities are limitless, like the sample image below, just be tuned!


Leave a Reply