
The goal of a breakout strategy is to profit on a large move that follows a pattern that is relatively easy to spot. Seasoned traders know the importance of being ready for several false breakouts while catching the momentum. As the name suggests, it refers to an attempt to break out of an established level that fails to go further. Traders should be aware of false breakout … [Read more...] about How to Trade False Breakout
Charts
Line, Bar, Candlestick, Renko, and Heiken Ashi Charts in Forex – How Each of Them Are Used

Overview To the layman, looking at any forex chart seems complex. Yet in no time, they become easy to read. A chart is nothing more than a visualization of the price of a forex pair over many time frames, ranging from minutes to months. Having competent charting skills is a crucial component of technical analysis - an approach used by the majority to make trading … [Read more...] about Line, Bar, Candlestick, Renko, and Heiken Ashi Charts in Forex – How Each of Them Are Used
Getting It Right With Triangle Chart Patterns

Formation Triangle patterns are formed during periods of consolidation in forex charts usually. Typically, they come midway through either an uptrend or a downtrend. The most important aspect of these formations is that they usually signal a high likelihood of a continuation of an existing trend. When a breakout is spotted leaning towards the previous trend, traders take … [Read more...] about Getting It Right With Triangle Chart Patterns
Bull Trap
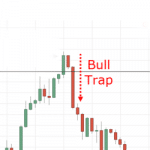
A bull trap is a pseudo breakout scenario. What happens here is that a buyer goes into a trade with the belief of an upside. Sometimes such stocks do not give an upward trajectory and hit the support levels of the trader's stop loss. What exactly makes the bull trap important? Let's find out! In a bull trap, long-term traders get forced to leave their positions as a result … [Read more...] about Bull Trap
How to Trade with Line Charts
Nowadays, when it comes to trading, technical analysis has become popular with the growing use of personal computers. All traders need to do is opening their trading platforms and using technical analysis tools on different currency pairs and financial markets. However, in the early days of technical analysis, it was not this easy. Developing trend indicators or oscillators was … [Read more...] about How to Trade with Line Charts