Chart patterns are utilized by traders to simplify trade inputs. They are price action patterns on the chart that have more than average probability of movement in a specific direction. So, which amongst them occur most frequently and are well worth knowing about?
There is a nauseating number of ways in which one can trade currencies, which is why there are some common ways and methods that one can implement to save much needed time, effort, and, most importantly, money. Certain chart patterns appear regularly, the study of which can simplify trading to some extent and provide one with a plan.

While some chart patterns can get complicated, there are certain ones that are simple to recognize and take advantage of through their basic visual elements. Let’s take a look at some of them.
Head and Shoulders
Simplified as H&S, this pattern is formed by the combination of topping pattern after an uptrend and a bottoming pattern after a downtrend. The former is a hike in price, followed by a retraction, another price hike, and a lower low. The latter, on the other hand, is a low (that makes one shoulder), followed by a retraction, a lower low (making the head), and finally, another retraction that leads to a higher low (making the other shoulder).
The pattern comes into view when the line that connects the highs (bottoming) or the lows (topping) has a dent, as is shown in the following image.
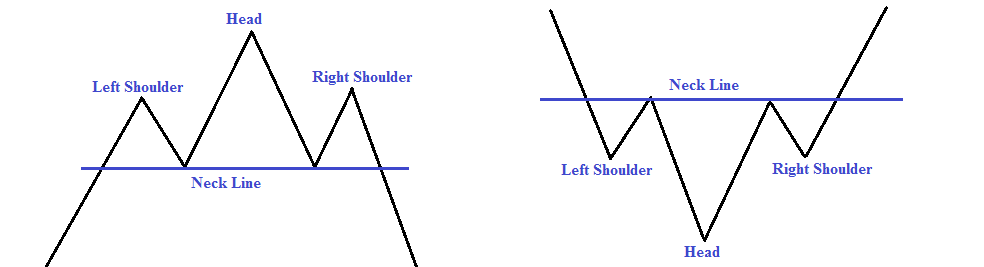
One can easily trade this pattern as it provides a clear-cut entry/exit as well as a stop-level.
Triangles
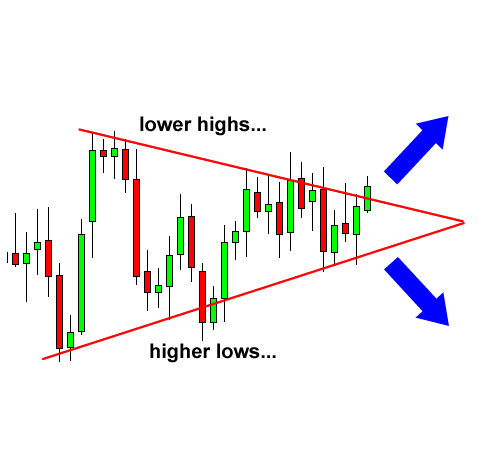
Triangles are some of the most common patterns, especially when one trades on a shorter timeframe. These tend to arise when the highs and lows converge into a shorter and shorter area.
These tend to be of three different types, which are as follows:
- Ascending
- Descending
- Symmetric
For trading, there is not much difference between the three. The advantage of chart patterns is that one can easily trade them with clear entry/exit, stop, and profit targets. An example of a symmetrical triangle pattern is shown below. Entry is at the point when the triangle is penetrated, exit at the pattern’s low; profit is ascertained by adding the entry price to the height of the triangle.
Engulfing Pattern
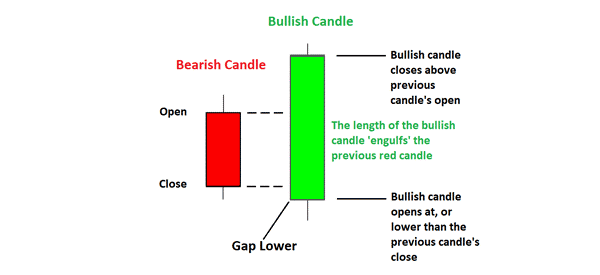
There is more information in candlestick charts than any other type of chart. That is why these are considered most useful for estimating movements in price on any timeframe. Now, there are numerous such candlestick patterns but amongst them, one is particularly helpful, which one should know about, and that is the engulfing pattern.
It is not only very easily identifiable but also gives a good indication of a strong directional change. When in a downtrend, an up candle body subsumes the previous body, it is known as a bullish engulfing. On the other hand, bearish engulfing is when a down candle body subsumes the previous body.
The reversal of the price action as highlighted by this pattern makes it easily tradable. Traders can start at the beginning of the trend and apply a stop. The image below highlights the bullish and bearish candles that signal the emergence of trends.
Conclusion
There is a spate of trading methods and mechanisms that utilize patterns to indicate entry/exit and stop levels. Some of them, such as H&S, triangle, and candle patterns, are very easily recognizable. Traders can easily take advantage of them through their predictable movements that make up the pattern.
The patterns described here can be complex enough based on your level of analysis since there is an inexhaustible amount of information that one can possibly derive from them. As traders progress, they can combine patterns to create their own system and methods that can aid them better in trading forex.


Leave a Reply