The exchange rates in the forex market fluctuate in response to varying forces of demand and supply. Whenever demand for a given instrument is high, its price inevitably rises. Similarly, the price would fall whenever demand is low. Gauging and analyzing supply and demand forces is crucial to staying on top of the game when it comes to forex trading. Money Flow Index is a popular analysis tool that technical analysts use to gauge how money flows in and out of an instrument in the forex market.
What Is the Money Flow Index?
Money Flow Index is a momentum indicator used in technical analysis to ascertain overbought and oversold financial instruments conditions. The indicator relies on price and volume data to ascertain money circulation in an asset. Besides, it is often used to spot divergence, which provides early warning signs of a potential price change after an extended period in one direction.
The indicator oscillates between 0 and 100. A reading of above 80 often signals overbought conditions in a market, on a financial instrument’s price moving up for an extended period. Likewise, a reading of below 20 signals oversold conditions on the price of a given tanking significantly over an extended period.
Just like other oscillators, the indicator also signals divergence in the market. For instance, whenever the indicator is rising while the price of security understudy is falling, the same could often signal a potential price reversal. In most cases, the price would often end up tanking.
Money Flow Index stands out from other momentum indicators such as the Relative Strength Index relying on two variables, price, and volume. In this case, the MFI indicator is considered a leading indicator as it is highly reliable in providing reliable signals and early warning signs of potential price reversals.
Using the Money Flow Index in Trading
Oversold Condition
The Money Flow Index indicator operates the same way as other momentum indicators in providing valuable information about market conditions. Whenever the reading on the indicator is below 20, a trader should be extremely cautious about entering short positions.
Any reading below 20 should signal a start of short-exposure reduction as an underlying asset is overly oversold. In most cases, the price would often reverse on sellers exiting the market as soon as it becomes apparent security is oversold.
Consider the Google stock chart above. Price had moved lower, resulting in the MFI indicator plunging below the 20 levels, conversely signaling oversold conditions. Traders entered long positions, conversely fuelling an uptrend as soon as a bull candlestick was formed at the sell-offs lows. With the MFI indicator’s help, traders were already anticipating price reversal as the indicator dropped below 20.
Overbought Conditions
Typically a reading of above 80 on the MFI indicator signals an instrument is overbought. Strong trends can see security remaining in overbought conditions much longer, with the indicator rising to 90 in some instances. Likewise, in a strong uptrend, the price can remain overbought for an extended period.
However, for momentum traders, overbought conditions present an opportunity to profit on a potential trend reversal.
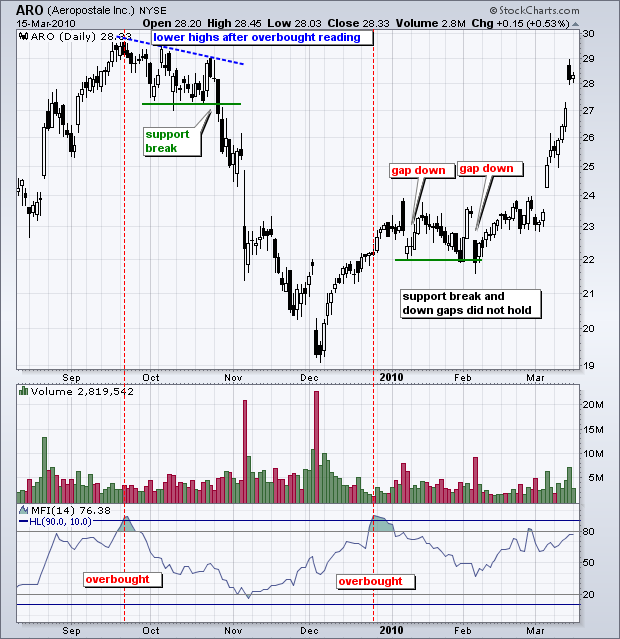
In the Aeropostale chart above, it is clear that the price moved up considerably, resulting in an MFI indicator reading of more than 90. The extreme levels in MFI signaled the advances were unsustainable, and a pullback was imminent. Similarly, the price started pulling lower with the sell-off accelerating as soon as the price broke through a critical support level.
Divergence with MFI
The fact that the MFI indicator relies on volume for its readings makes it an ideal tool for predicting price reversal. Reversal often occurs whenever price moves in a given direction over an extended period. However, after some time, volume in the underlying direction subsides, signaling a reduction in price conviction in the given direction.
Divergence occurs whenever the price is rising while volume in the uptrend is tanking, giving rise to what is often referred to as bearish divergence. The MFI indicator has proved to be highly effective in signaling such conditions.
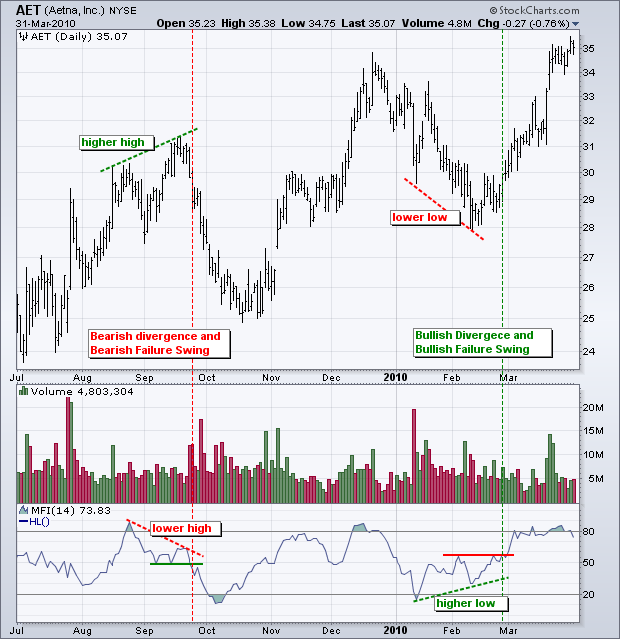
On the chart above, the price started rising in July, with the gains extending significantly through September. Simultaneously, the MFI indicator rose past the 80 levels to 90, signaling an extreme overbought condition. Afterward, the indicator started dropping while the price was still growing.
It was a warning sign of a potential reversal for technical analysts as the MFI indicator was already tanking from overbought even as price was rising, signaling bearish divergence. Late September price reversed and started edging lower.
In early 2010, a bullish divergence was also seen whereby price moved lower significantly to the extent of the MFI indicator plunging below the 20-mark, signaling oversold. However, price continued to edge lower even as the MFI indicator started bottoming out from the oversold territory, signaling bullish divergence. Early March Price reversed from the lows edging higher as the MFI indicator was also rising.
While overbought conditions provide ideal conditions for entering short positions, it is essential to note that price can remain in overbought conditions for an extended period. Similarly, the price can stay in oversold condition for an extended period.
That said, it is essential to use other analyses and technical indicators to confirm potential reversals from overbought and oversold conditions. Therefore the MFI indicator should never be used in isolation or followed blindly when carrying analysis.
Bottom Line
Money Flow Indicator is a unique leading indicator that combines price and volume to provide reliable signals when it comes to overbought, oversold, and divergence conditions. The indicator is also a key measure of market sentiment as it often shows traders’ enthusiasm or indifference.
However, it is essential to note that the indicator is not always accurate. Therefore it is vital to use the MFI indicator in conjunction with other forms of analysis and suitable risk management strategies for better outcomes.

Leave a Reply