
Formation
Triangle patterns are formed during periods of consolidation in forex charts usually. Typically, they come midway through either an uptrend or a downtrend.
The most important aspect of these formations is that they usually signal a high likelihood of a continuation of an existing trend. When a breakout is spotted leaning towards the previous trend, traders take it as an invitation to open a position in the main trend’s direction.
Triangle patterns present themselves in three main forms: ascending, descending, and symmetrical. As you may probably deduce from their names, the biggest feature among the three charts are their slopes.
Ascending patterns indicate bullish control, descending patterns show that the bears are in charge, while symmetrical patterns denote an equilibrium between bulls and bears. Therefore, a breakout from this pattern comes when either the bulls or bears win the battle.
Symmetrical triangle formation
This pattern is formed when upwards price momentum and movements downwards become progressively smaller and less frequent. This results in new highs becoming lower than the previous highs and new lows becoming higher than the previous lows. This effectively makes the area formed to be smaller.
We get the symmetrical triangle when a line is drawn to connect the highs on the upper side and the lows on the lower end of the formed area, leading to the convergence or near-convergence of the two trend lines. Note, however, that we only need two highs and two lows to draw the trend lines, with the rest of the points being extrapolations.
However, it is recommended that you wait for at least three highs and lows to be formed before you draw the two trendlines. Once you have the lines in place, you should wait for a breakout to guide you on whether the next trend is likely to be to the upside or to the downside.
Remember to place your stop loss below the lowest end of the triangle. Measure the height of the triangle and use it to locate your take profit point.
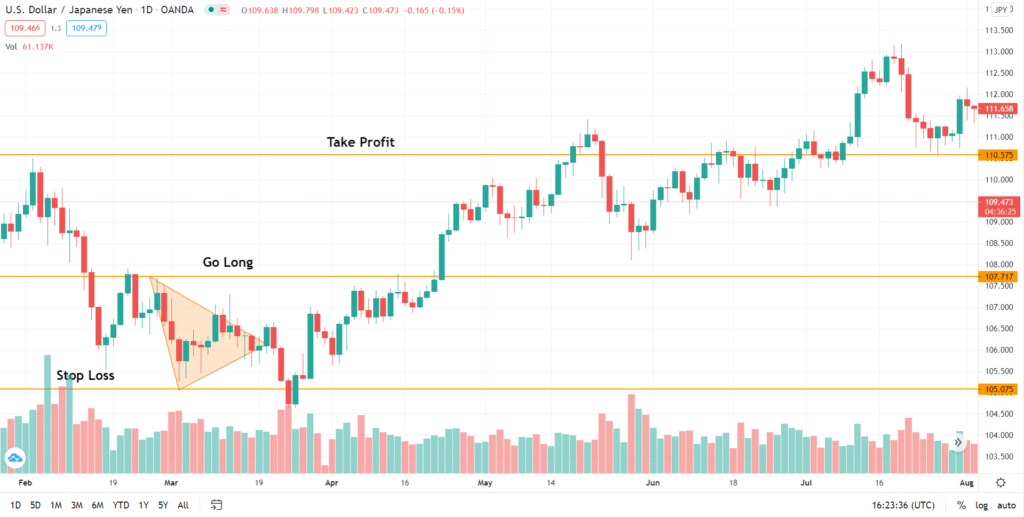
In the chart above, the breakout led to an upswing. A buy position was opened at 107.717. The stop loss was placed just below the triangle at 105.075. The triangle’s height was measured and used to locate the take profit, which landed at 110.575.
Descending triangle
This formation comes when the highs in a trading session progressively get lower, with the new swing lows matching the levels reached by previous lows. The base of the triangle pattern formed comes from the drawing of a trendline joining the lows. The slope comes from the joining of the falling highs, using a trendline.
The price trend results in the narrowing of the area covered by the candlesticks, as new lows consistently settle at the same level as the previous lows. Usually, it requires only two highs and two lows to draw the triangle’s slope and base. However, three points on the highs and lows are more assuring. In case you are unable to spot the third point, you can use the two points and extrapolate the rest by following the trajectory of best fit.
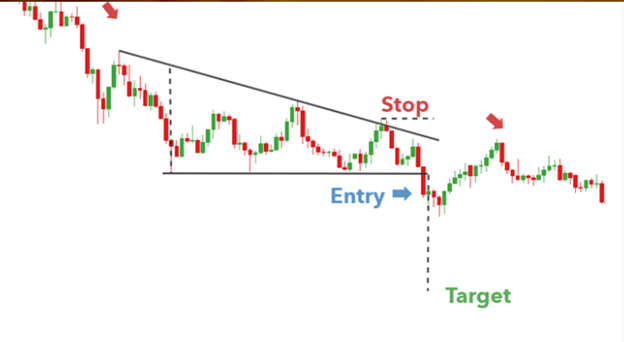
For example, in the USD/JPY chart below, strong action by sellers results in a period of sideways price action or consolidation. Thereafter, the bears have their way for a brief period. This leads to many traders shorting the asset.
However, this is followed by another counteraction by buyers, leading to a reversal of the previous trend. Using this strategy, you take your profit using the height of the triangle.
Ascending triangle
This formation comes when the price oscillates from an established resistance level and an established support level, which it touches repeatedly, but which it does not break. Each time the price does not break the resistance level, the market reacts with a sell-off. This is repeated several times. However, each subsequent sell-off is progressively lower than the previous one.
After several attempts, the resistance finally gives in, and the price assumes an ascending trajectory. The ascending triangle signifies that the previous pattern is likely to resume after the consolidation. For example, the formation of a downtrend usually indicates a high chance of a reversal of the trend.
An example of an ascending triangle is shown below. An uptrend is followed by a consolidation, as the buyers and sellers absorb each other’s orders.
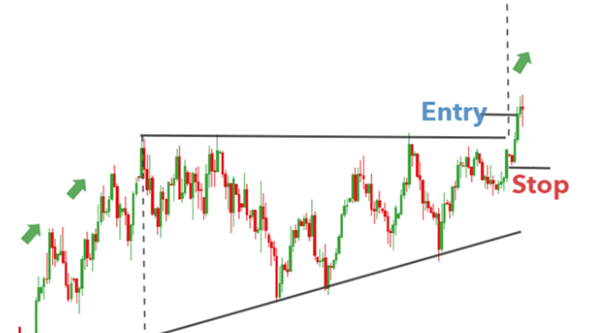
The triangle’s height shows the best level to take profit. You can place your stop loss just under the recent low before the breakout.
Bottom line
Triangle patterns, when used right, can be effective in helping traders maximize their profits. They are helpful when we want to know the optimal levels to either enter a trade or exit it. It is always important to incorporate other relevant indicators and market fundamentals to increase the odds of success.


Leave a Reply