Timing the market is often a controversial method of participating in the financial market. On the one hand, it is often criticized by long-term investors like Warren Buffett and Bill Ackman as unworkable. At the same time, it is often praised by day and swing traders. In this article, we will look at what timing the market is and some of the popular tips for using it.
What is timing the market?
Timing the market is a trading strategy where your goal is to identify market opportunities and take advantage of them with a short-term view. For example, assume that an asset has moved from $10 to $15 within a few months. Then it suddenly drops to $12 in a single or few sessions. In this case, a market timer can rush and buy the dip, hoping that it will soon rebound.
In some cases, timing the market can work perfectly. In this, it can rebound after you have initiated a buy trade. However, at times, it can continue the bearish trend, leading to substantial losses.
Timing the market can happen across all the asset classes, including stocks, commodities, forex, and even exchange-traded funds.
It is also worth noting that it does not only happen among day and swing traders only. At times, it happens when long-term investors rush to buy an asset now that its price has crashed. It can also happen when a trader rushes to short a stock that has made a parabolic rally.
Timing the market vs. time in the market
Timing the market is often used in the same sentence as time in the market. Time in the market refers to a person who buys or shorts an asset and then holds it for a long time. They don’t try to guess when the asset has found a bottom to buy or when it has topped. As such, when they initiate a trade, they know very well that the timing might be wrong but that it will eventually do well.
A good example of a time in the market is Bill Ackman, who invested in Chipotle Mexican Grill (CMG) when the stock was at $400. Shortly afterward, the stock lost its value, but he did not sell. At the time of writing, the stock is trading at $1,850.
So, which is better between timing the market and time in the market? In reality, the two approaches can work well when used properly. Let us now look at some of the best approaches to timing the market.
Timing the market using dollar-cost averaging
One strategy you can use to time the market is known as dollar-cost averaging (DCA). It is a process in which you don’t buy or short the asset at once. Instead, you divide your funds and enter the market at certain periods. For example, if you have a $20,000 fund and you are interested in buying a stock, you can divide it five times. This means that you will have $4,000 to invest per trade.
In this case, if the stock dropped from $20 to $15, you could spend your first $5,000. If it keeps falling, you could buy more shares at $12, followed by $10 and $8. If you are right and expect that the stock rebounds to $30, you will have made more money using dollar-cost averaging than if you made a lump sum order. You can also use the strategy when you are shorting a stock.
While the DCA strategy works well, it is not without risks. The biggest risk is where the stock or another asset continues dropping and does not bounce back. Another risk is where it drops and then sharply rebounds before you exhaust your entire bundle of cash.
Timing the market using indicators
Another strategy of timing the market is using technical indicators. Fortunately, there are many indicators you can use when timing the market. One of the best is known as Moving Average (MA), which is a popular trend following indicator. It has several types, including simple, exponential, smoothed, weighted, and volume-weighted.
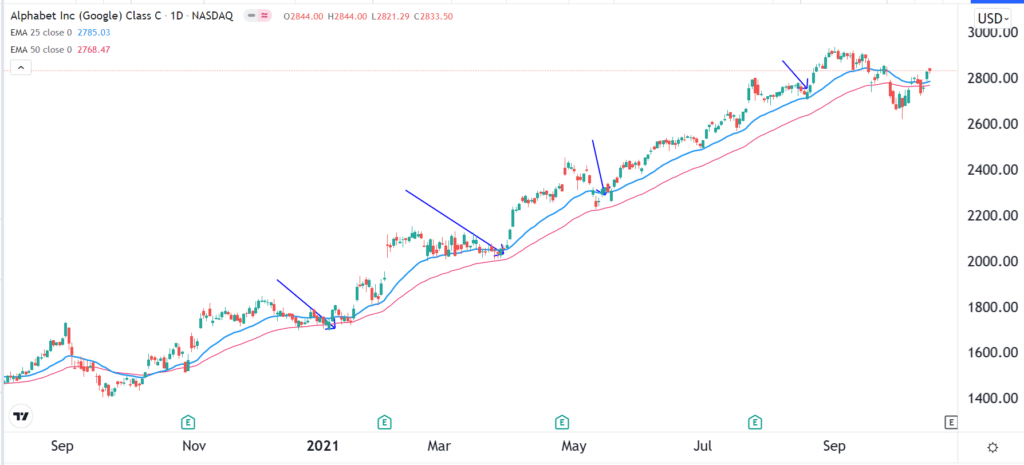
You can use either of these Moving Averages in several ways. For example, you could use a 50-day or 100-day Moving Average on a daily chart. If the stock is in a strong bullish trend and it suddenly drops, you will buy the dip when it moves to one of these averages.
For example, the chart below is a daily chart of Google shares. In it, we have added 50-day and 100-day Moving Averages. As you can see, during the uptrend, the price is comfortably above the two averages. However, there are times when it makes a pullback. As such, you can time the market by buying when it drops to either of the Moving Averages.

Other technical indicators you can use to time the market are Ichimoku Kinko Hyo, Bollinger Bands, Donchian Channels, MACD, and Relative Strength Index (RSI).
Using charting tools
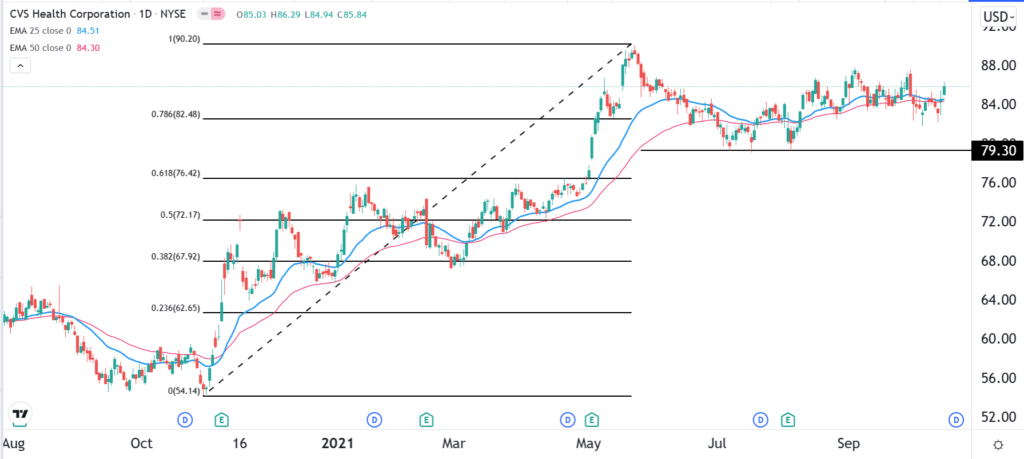
The next strategy of timing the market is to use technical tools that are provided by most platforms. Some of the popular tools you can use are the Fibonacci retracement and Andrews Pitchfork. For example, in the chart below, we see that the CVS share price struggled to move below the 23.6% Fibonacci retracement level.

Therefore, you could time the market because it is a signal that there are not enough sellers to push it further lower.
Final thoughts
There are other strategies you could use to time the market. For example, you could use price action patterns to do that. The patterns like triangles, pennants, and flags to find are classic setups that offer entry points. These patterns are classified into continuation and reversals. Continuation patterns like ascending and descending triangles will often see the asset continue moving in the original trend. On the other hand, reversal patterns like head and shoulders and wedges will see the price change its direction.


Leave a Reply