Indicators are at the heart of technical analysis in the forex market, as they allow traders as well as forex robots to analyze past and anticipated future price trends. The best forex indicators enhance the identification of trading opportunities as well as entry and exit points.
Table of Contents
Trading strategies such as scalping, trend trading or swing trading rely on technical indicators to determine entry and exit points in the forex market. Therefore, indicators are vital forex trading instruments when it comes to analyzing chart patterns as part of technical analysis.
Some of the commonly used indicators include Moving Averages, Stochastic as well as Relative Strength Index and Bollinger Bands.
Using Indicators to Develop Forex Strategy
Indicators help traders and forex expert advisors identify market conditions and should never be confused to a trading strategy. A trading strategy includes indicators in addition to other forex trading instruments.
There are different categories of forex indicators that traders should have a clear understanding of. For instance, there are momentum indicators that signal strength of an underlying trend. Similarly, there are trend indicators that shed more light on the underlying trend. Conversely, traders, as well as other forex trading instruments, should avoid using different indicators of the same type as it often results in multiple counting of the same information.
Likewise, the type of indicator deployed comes down to the trading strategy in play. For instance, a trader looking to profit from a long term trend, a trend following indicator such as moving average, would be well suited for the strategy.
A trader focused on small moves with frequent gains, as is the case with swing trading, scalping or news trading, would then have to rely on volatility indicators.
Developing Indicators Trading Strategy
Moving Average Strategy
Moving Average and Relative Strength Index are some of the best forex indicators used in various strategies in trading currency pairs.
Moving average is a trend following indicator that technical analysts use to identify the prevailing trend. The Relative Strength Index, on the other hand, is a momentum indicator that details market momentum. Likewise, the indicator is used to ascertain market conditions, i.e. overbought or oversold.
With this strategy, we will use the 20 exponential moving averages. Conversely, whenever the price is above the 20EMA, the same is interpreted as an uptrend and traders or automated trading systems would eye buy opportunities.
However a buy opportunity is opened in case of an uptrend on confirming the same and confirming the same using the Relative Strength Index. Whenever the RSI is above 50 the same signifies that the uptrend is gaining momentum. In return, when the RSI is below the 50 levels, the same signifies a downtrend.
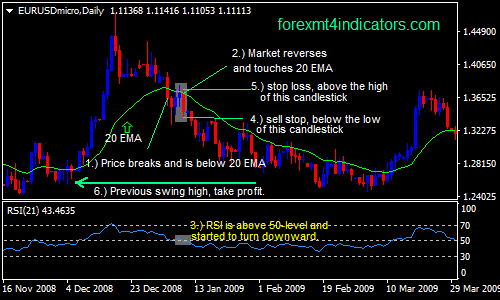
In the chart above it is clear that traders who entered a long position at position 1 when price closed above the 20 EMA and the RSI indicator closed above the 50 level ended up generating significant profits as price continued to power up the charts.
Similarly, traders or forex trading instruments that opened short positions at position 2 as soon as price closed below the 20 EMA and RSI closed below the 50 level ended up generating significant profits as price edged lower.
MACD and Stochastic Indicators Strategy
Moving Average Convergence and Divergence with Stochastic are two of the best forex trading indicators that work well when paired together, giving rise to one of the best strategies in the currency market. The two work well because MACD is a formation of two moving averages diverging and converging. Likewise, the stochastic indicator compares a stock’s closing price to its price range.
The MACD indicator comes with two moving averages, a fast-moving and a slow-moving average. In this case, when the fast-moving moving average, often referred to as a signal line, is above the slow moving average the same signifies an uptrend. Likewise, when the histogram is above the equilibrium line, the same affirms an uptrend. In return, when the fast-moving average crosses the slow moving average from above the same implies a downtrend.
The stochastic being a momentum indicator, comes with readings of between 0 and 100. When the stochastic indicator is above the 50 center line, the same implies an uptrend while values above 80 imply overbought condition. Likewise, whenever the stochastic crosses the 50 line and moves lower, the same implies a downtrend while a value below 20 signals oversold conditions.
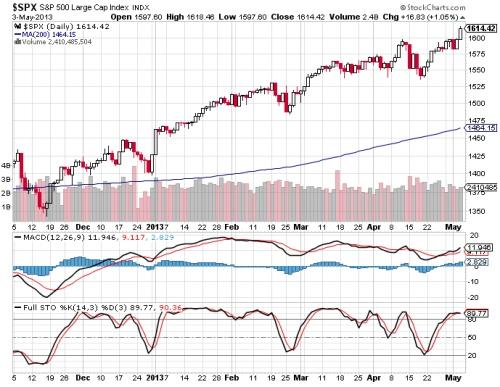
A closer look at the chart above, it is clear that price closed above the long term moving average, as 2012 came to a close. As price closed above the long term moving average, a bullish crossover occurred on the MACD indicator, with the histogram lying above the equilibrium line, signaling the emergence of a bull trend.
Similarly, the stochastic indicator started edging higher conversely rising above the 50 level, signaling a strong upward momentum. Traders that opened long positions as soon as a bullish crossover occurred at the end of 2012 ended up generating significant returns as price continued to edge higher.
Conclusion
Indicators are important forex trading instruments used to identify market conditions as well as ideal entry and exit points. Likewise learning various indicators is a sure way of determining various strategies for using to squeeze profits in the forex market.


Leave a Reply