Ichimoku Indicator Components
Ichimoku Indicator is one of the best forex indicators for automated trading. The algorithmic FX trading indicator is best known for providing reliable information about support and resistance levels. Also, it is also used to ascertain trend direction and momentum when analyzing chart patterns in the market.
The indicator finds excellent use in technical analysis while hedging, scalping, or in arbitrage trading. Similarly, it is one of the most used forex charting tools for news trading and trend trading. Ichimoku Indicator stands out as one of the best forex trading instruments given its ability to gauge future price momentum as well as determine support and resistance levels for deciding entry and exit points.
The manual and Automated FX trading tool is made up of two main components. The conversion and baselines look like moving averages and the Ichimoku cloud, which is the central aspect of the forex charting tool.
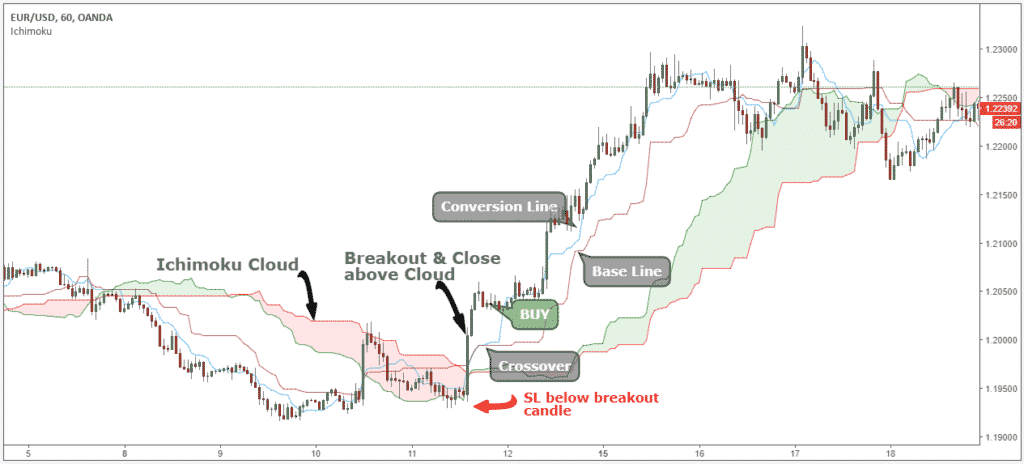
The conversion and baseline are not moving averages but only lines that show the middle of the9 and 26 period high and lows. The baseline takes the highest and lowest price levels of the 9 and 26-period candles and then plots a line. In the chart above the green and red lines represent the base and conversion lines of the Ichimoku chart. The white line, on the other hand, is a 9-period moving average.
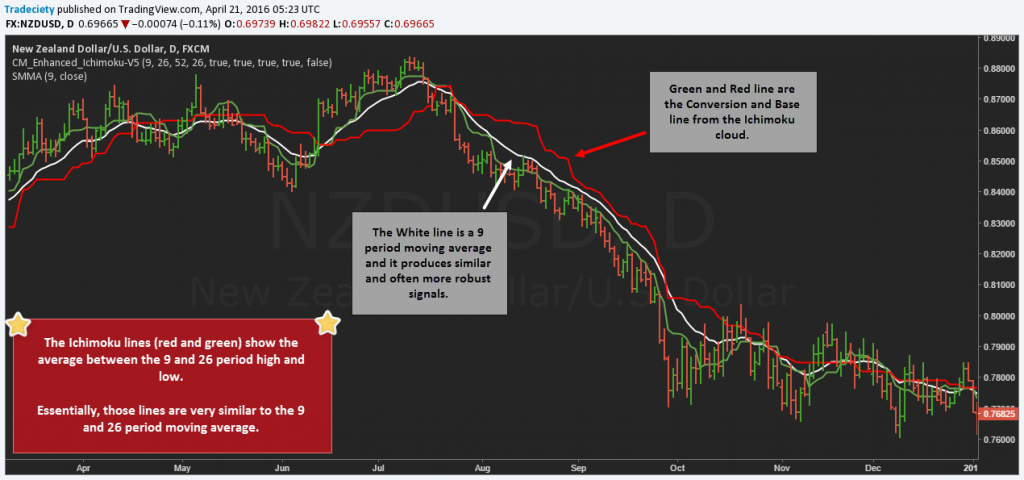
The conversion and baseline are used to indicate support and resistance levels in technical analysis. Besides, they provide vital information about market momentum. Whenever the price is trading above the two lines, and the conversion line is above the baseline, the same implies bullish momentum. Whenever price moves above the two lines, the same means strong market momentum. In this case, a trader can open a buy position manually or with the help of Forex Expert Advisor.
Ichimoku Cloud
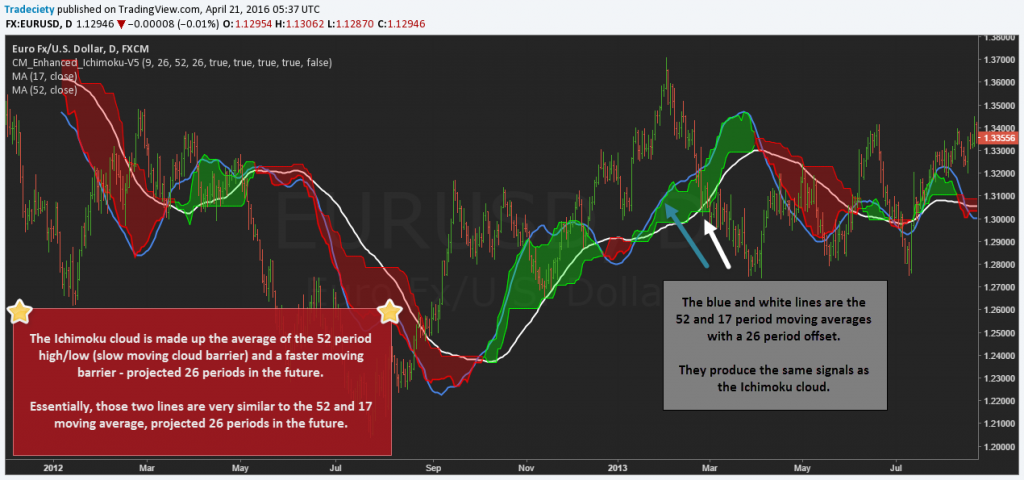
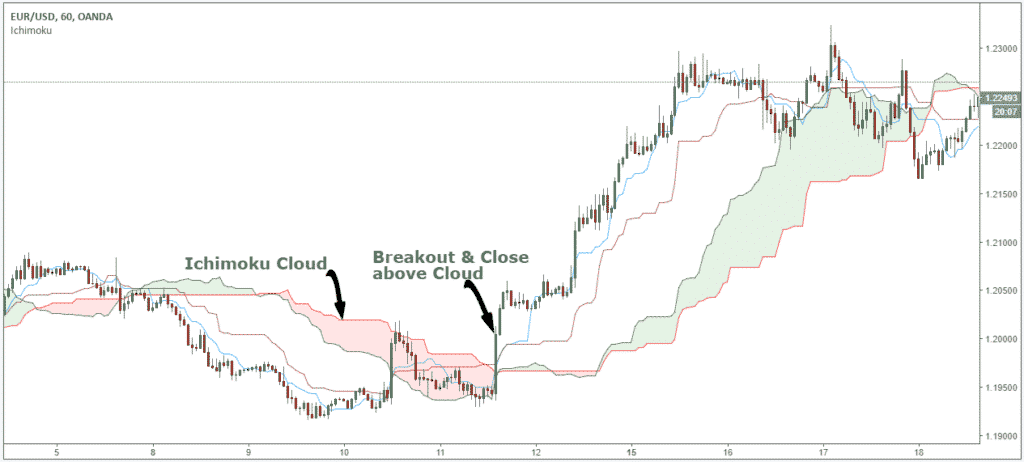
The Ichimoku cloud comes with a lower and upper boundary as well as a space between the two lines. The cloud is often shaded green or red. The faster-moving boundary of the cloud is simply the average of the conversion and the baselines. The slower moving boundary, on the other hand, represents the middle of the 52-period high and low.
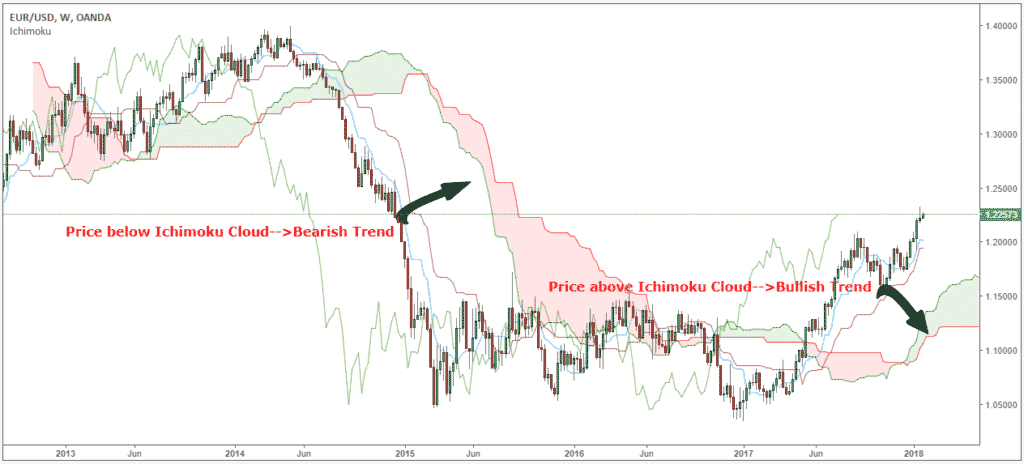
Just as is the case with the conversion and baseline, the Ichimoku Cloud acts as a support and resistance and uses to indicate trend direction and momentum. Similarly, whenever the price of the underlying security is above the cloud, the same is interpreted as an uptrend, and when the price is below the cloud, the same is interpreted as a downtrend.
The space within the Ichimoku cloud is simply a noise zone. Traders are often advised to refrain trading when the price is within this range. Conversely, a rally is affirmed when the cloud is green and downtrends when the cloud is red.
The Best Ichimoku Trading Strategy
The Ichimoku indicator, when used, allows traders to remain on the right side of the market until there is a reversal. Likewise, as one of the best forex trading indicators, Ichimoku suits swing traders.
Ichimoku Buy and Sell Signals
The only time that traders should open a buy position is when the price is above the Ichimoku Cloud, as the same implies, the market is bullish. Likewise, as long as the price is above the cloud, the same implies an uptrend, and that price is likely to continue edging high.
Conversely whenever price breaks below the Ichimoku cloud the same signals a market shift or reversal indicating that the market has turned bearish and that price is likely to continue edging lower.
Further confirmation of the buy and sell signal would be affirmed by the crossing over of the baseline and the conversion line. In this case, the conversion line crossing the baseline from below indicates a bullish momentum, and that price is likely to continue powering high.
Similarly, whenever the conversion line crosses the baseline from above, then the same implies bearish momentum, and that price is likely to continue edging lower.
Ichimoku chart patterns can also be used to ascertain the best points to place a stop loss to mitigate losses. The ideal location to place a stop-loss order would always be below the low of the breakout candle once a crossover happens. By placing a stop loss below the crossover and signal candle, a trader would merely be looking to benefit from the new trend.
Likewise, the Ichimoku indicator can also be used to set a take profit order. In case of an uptrend, an ideal place to take profits would be when the conversion line crosses the baseline from above. Conversely, you can also wait for the price to break below the cloud to take profits.
Conclusion
Ichimoku Indicator is arguably one of the best forex charting tools when it comes to technical analysis. As a money-making hack in technical analysis, the indicator simplifies the process of ascertaining support and resistance levels as well as momentum levels. Similarly, the indicator is commonly used by FX Expert advisors in generating reliable buy and sells signals.


Leave a Reply