
The Donchian channels indicator is a trend-following tool that was named after its inventor, World War II veteran Richard Donchian. For his contributions to the FX market, he was dubbed the father of trend following trading. This indicator illustrates the volatility of a market in a graphical format.
At face value, the indicator appears like the Bollinger Bands, but the two indicators vary in functionality. Bollinger bands are created using standard deviation from a Moving Average, while Donchian channels are created by joining the highs and lows on a price chart over a predetermined period.
What are Donchian channels?
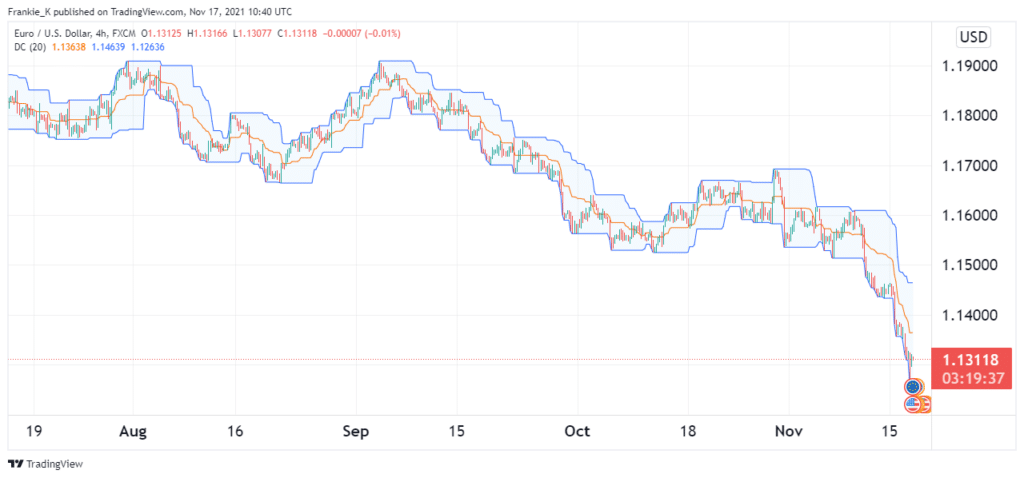
The example above features a EURUSD chart contains the Donchian channels indicator. It consists of an upper, middle, and lower band. The upper band is made by joining the highest swing high over n periods, of which, in our case, n = 20.
The lower band is made by joining the lowest swing lows over the same period. The middle band, on the other hand, is obtained by calculating the difference between the upper and middle bands and then halving it. That is:
Middle band = ((upper band – lower band)/2)
Twenty is the default setting on most platforms, but you’re free to tweak it in line with your strategy.
How to read Donchian channels
In this indicator, the upper band shows the bullish momentum of a currency pair’s price. When prices adhere to this band, the market tends to be in an uptrend. The median line represents a shift in momentum when prices cross it, which may point to a trend reversal. Other times, it acts as a support when prices bounce off of it, indicating the resumption of the underlying trend.
Further, the width of the channel gives a measure of the market volatility. When the channel is wide, prices are highly volatile as swing lows, and swing highs are far apart. Similarly, when the channel narrows, it indicates that prices are in consolidation. In ranging markets, the lower and upper bands act as support and resistance levels.
The lower band represents growing bearish pressure when prices adhere to it. It follows then that when the channel is sloping upwards, the currency pair is in a bull market, while when it slopes downwards, the bears have the upper hand. When the channel flattens, it points to a market in consolidation.
Obtaining trade signals
- Breakouts
This is the most common use case of these channels. This method is used when markets are ranging, which is characterized by flat, narrow channels. As aforementioned, when price touches the upper band, it points to a bullish breakout. This would give the ideal entry for opening long trades.
Similarly, when prices touch the lower band, it points to the beginning of a bearish breakout. This gives the signal to enter short trades. However, to avoid fakeouts, it is prudent to wait for the second consecutive candle to touch the relevant band before trading a breakout.
- Pullbacks
Pullbacks are used to produce trade signals during trending markets. This method utilizes the middle band of these channels. For instance, when the market is in an uptrend and prices retrace to the middle band, a pullback from this band would provide the opportune entry for a long trade. Similarly, a pullback from the middle band in a bearish market would provide the signal for a short trade.
- Reversals
The center band of these channels is also useful in confirming trend reversals. For instance, if the market was in a downtrend and prices retraced towards the centerline, a break past the center band would indicate that a bullish reversal was forming. If one had any open short trades on the pair, that would be the signal to close their positions. Similarly, one could open new long trades in such a scenario to take advantage of the bullish reversal.
The same concept applies when prices in an uptrend break below the center band.
Trading strategies using the Donchian channels
As Dr. Alexander Elder so famously said, no one indicator can be sufficient to produce accurate signals as a standalone entity. The Donchian channels are no exception. For improved signal accuracy, it is prudent to combine them with other indicators when generating trade signals.
Donchian channels and RSI
The example below shows the Donchian channels indicator in use in conjunction with the Relative Strength Index (RSI). On 3rd September, RSI showed that the EURUSD pair was overbought, which pointed to a possible bearish reversal in the works. Soon after, prices broke past the middle band of the Donchian channels, which confirmed the reversal. This gave the entry for a short trade.
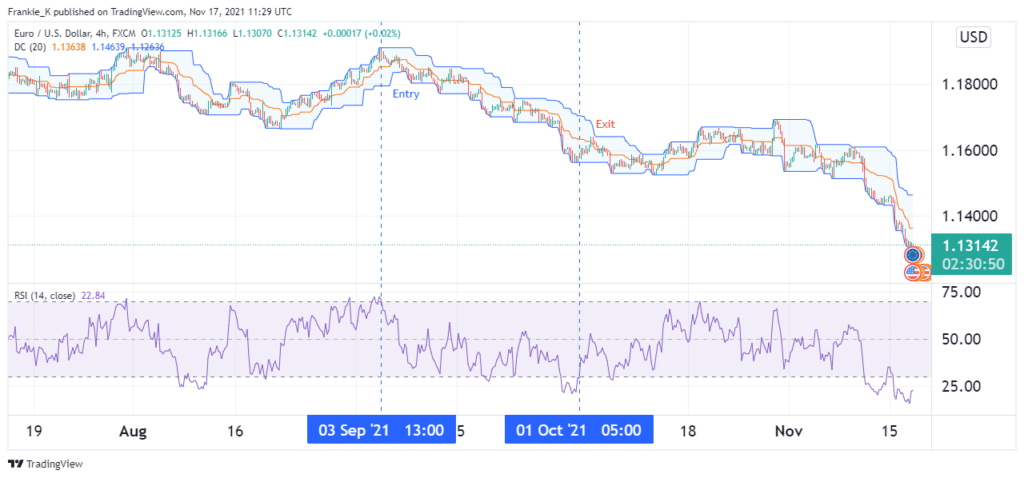
On 1st October, RSI showed that the pair was oversold, pointing to the end of the bearish trend. This was confirmed by prices breaking above the middle band of the channel. Though the bullish reversal didn’t happen, prices went into consolidation, which was reason enough to exit the trade.
Donchian channels and MACD strategy
The figure below shows the Donchian channels in use with the MACD indicator. On 10th November, the MACD histogram crossed below zero, indicating the start of a bearish run.
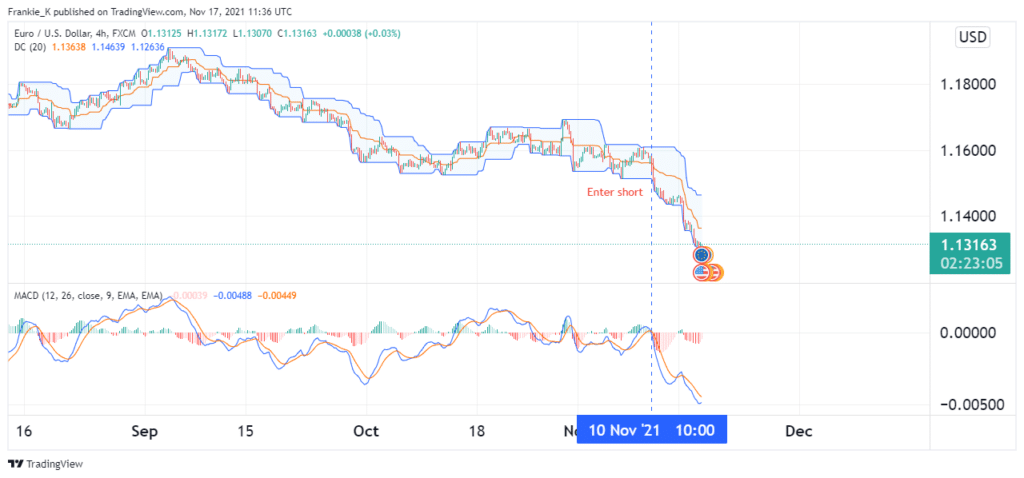
This was confirmed when prices crossed below the Donchian channel’s middle band and adhered to the lower band. This gave the entry to a short trade. The exit signal for this trade will be when MACD crosses to the positive zone, and prices break past the middle band of the channel.
Conclusion
Donchian channels are an indicator that looks like the Bollinger Bands but is obtained by plotting the highest price peaks and lowest troughs over a specified period of time. They are useful in identifying breakouts from range-bound markets, pullbacks signaling a trend continuation, and trend reversals. For best results, these channels should be used in conjunction with other indicators such as the RSI and MACD.


Leave a Reply