
In recent years, the popularity of AUDUSD has been on the rise. The pair includes currencies of developed economies. It is currently among the top 5 most traded currencies in the Forex market.
Being one of the most popular pairs, you will have no execution-related problems when trading it. High liquidity allows less slippage, lower fees, tight spread, and greater market depth.
Tight spreads in this pair allow traders to get better bids and ask prices in real-time. In addition, the volume and volatility can be an advantage to a day trader.
In this guide, we will discuss the fundamental and technical aspects that you should take into account trading this currency pair.
Investing involves risks, but if you dedicate yourself to studying a specific asset, you will be more likely to succeed.
Fundamental aspects
Taking into account the news and economic indicators when trading Forex is essential. So, to trade this pair, we have highlighted some of the most important fundamentals that we will mention below.
Correlation with general market sentiment
The Australian dollar is a risk currency, which means it is susceptible to what may happen in the international market. As a result, the pair tends to rise during times of optimism and fall during times of uncertainty or fear. The following chart shows the 2020-2021 correlation between AUDUSD and the S&P 500 Index.
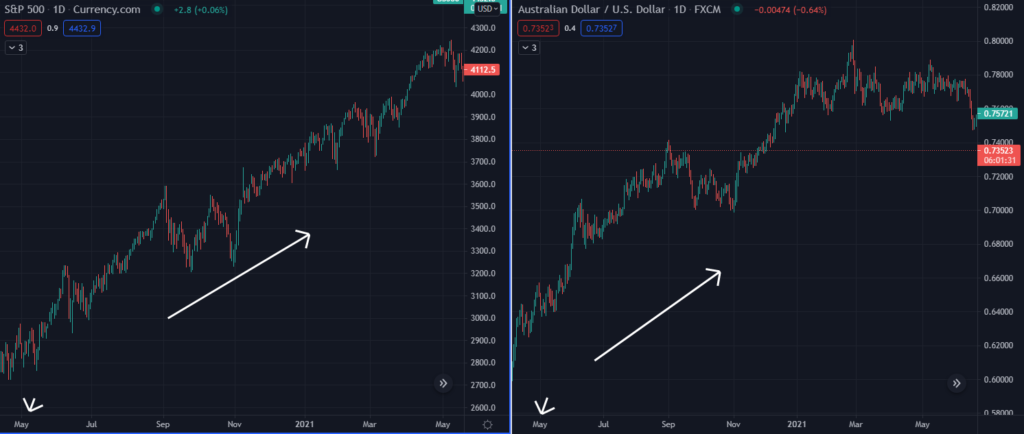
Generally speaking, it follows the primary market trend. Still, there is not always a total correlation between market sentiment and this pair.
For example, there are times when the AUDUSD is in a range, and the S&P 500 goes up or has a pullback; however, it depends on other factors that we will discuss below.
Australian commodities exports
Australia is a major exporter of iron ore, coal, gold, and copper. Therefore, the Australian dollar will also depend on the state of production and export of these commodities.
It is essential to be aware of the correlation between the price of these commodities and the currency pair.
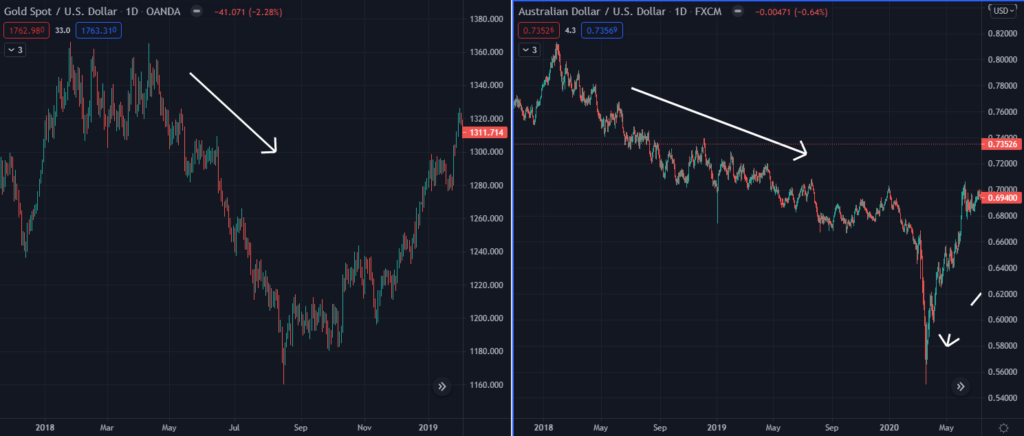
You will possibly see the commodities moving in unison with AUDUSD. For example, in the above chart, we see the gold and AUDUSD down-trending together.
Australian economic data and Reserve Bank of Australia (RBA) policy
Unemployment, GDP, consumer confidence, and inflation are the primary metrics of the US and Australia. However, suppose the economy of the oceanic country is stronger than the American one. In that case, you will see a good uptrend in this pair.
Also, on the first Tuesday of each month, the RBA sets the target short-term interest rate and issues monetary policy guidance. Should a cut in these rates occur, it would negatively affect the pair.
For example, in 2020, due to pandemics, the RBA slashed its policy rates to an all-time low (0.25%), causing the AUDUSD to fall.
Influence of China
Chinese economy influences the Australian dollar; China and Australia continue to have close trade relations, as the Asian giant is the leading importer of raw materials sourced in Australia.
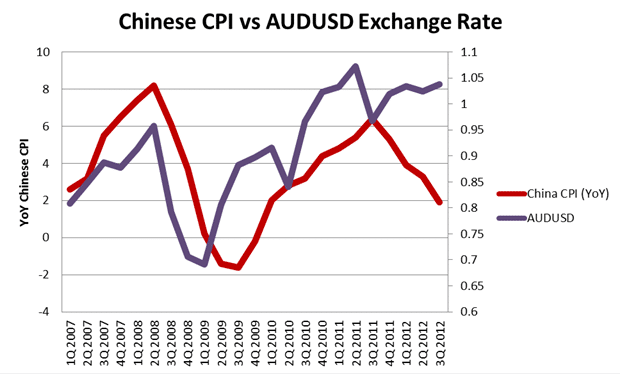
Therefore Chinese GDP, manufacturing PMI, industrial production, and retail sales figures are among the most critical data influencing the AUDUSD.
Technical aspects
Thanks to the high liquidity of this pair, you will be able to operate in scalping mode at peak hours without having a problem with the bid/ask spreads.
However, some traders may prefer to execute longer-duration trades, such as a swing trade. Either option for this pair is valid.
What’s the best time to trade AUDUSD?
Trading this pair between 19:00 – 04:00 GMT is the best time due to the high volume.
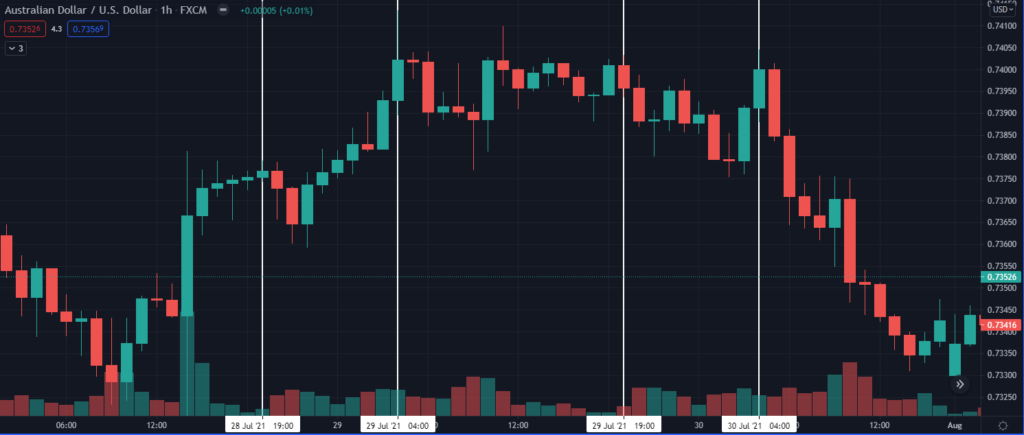
Although at this time, the Asian market is active, and the New York market is after trading hours, the overlap of these two provides a good amount of volume for intraday trading.
Best indicators and strategies to trade the AUDUSD
To trade this pair in the scalping or swing mode, we can use several indicators that we will show you below.
Scalping
Volume and momentum indicators are best to execute quick trades. However, indicators may give late entry signals because they do not include volume in their calculation.
Therefore, indicators such as On Balance Volume (OBV) or the Money Flow Index (MFI) are more accurate for such trades. Also, a good option is to identify overbought and oversold levels with the Relative Strength Index (RSI).
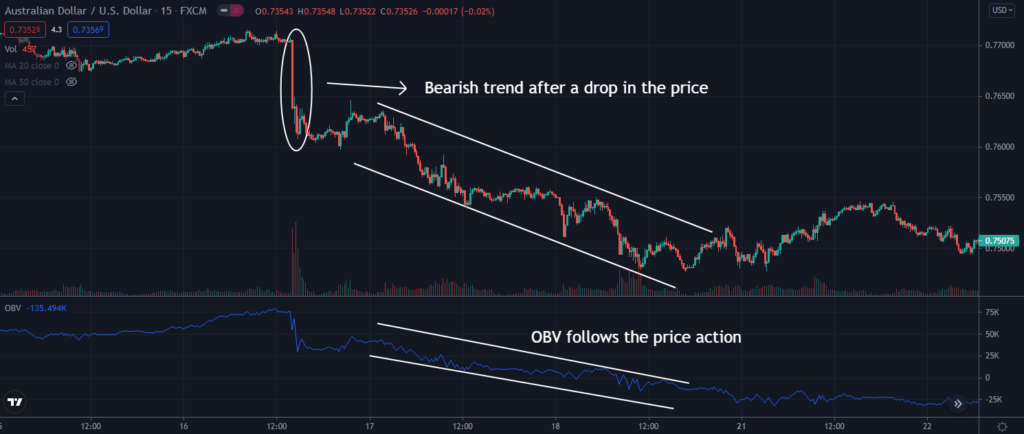
In the chart above, you can see how after a tremendous bearish candle, the price cannot recover, and OBV accompanies it. The most straightforward entry, in this case, is to follow the downtrend.
Swing
It is advisable for medium to long-term trading to use the more well-known momentum indicators such as Moving Averages or MACD. Using these indicators will help you identify trends and possible reversal points to enter the market.
Observe the following chart that shows how the entries would look, combining MACD and Moving Averages.
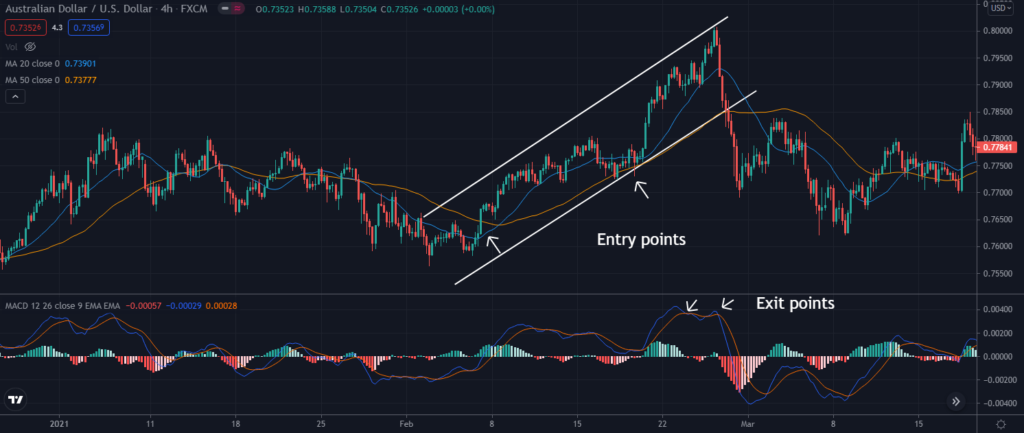
We buy when the price is crossing above Moving Averages, and we sell when the MACD line (see the blue line in the indicator window) crosses below the signal line.
Conclusion
The AUDUSD pair is an attractive instrument for active trading. It is necessary to emphasize that liquidity benefits short-term traders who base their trades on technical analysis.
As for long-term investors, the idea is to consider the fundamental aspects such as news and economic indicators of the international market and other countries that have trade relations with Australia.
Combining the fundamental aspects with technical analysis through indicators, we will have a strategy to help us to profit from trading this currency pair.


Leave a Reply