
Fractals are technical indicators that appear on candlestick charts and are used to indicate market reversal points. They are commonly used by traders to predict the direction of price movement. When a specific price pattern appears on a chart, a fractal will appear.
Fractals are made up of five candlesticks. When the price has battled to go higher, an up fractal will form; when it has struggled to go lower, a down fractal will develop. You can count on fractals to trade profitably when there is a stable trend. However, the tool is less reliable for trading when an asset’s price trajectory is flat.
The fact that fractals are commonly employed by some of the major traders is strong evidence of their reliability. A lot of forex traders utilize fractals to analyze market movements and make judgments based on patterns they see. By looking at the fractal pattern, traders can decide whether to purchase or sell the asset they’re interested in.
The mechanism behind the formation of fractals
Fractals can only go up or down. In up fractals, the middle candlestick is aligned in an upward direction while the outer candlesticks must point downward. This is a clear indication that the price of an asset has peaked and is now beginning a downward trend.
In a bullish trend, the middle candlestick points downward while the outer candlesticks are aligned downward. According to this chart, the price has dropped to its lowest level and is now beginning to rise again.
Traders use fractal trading to look for these patterns and then use the signals they receive to buy or sell an asset.
For each fractal pattern, there have to be five candlesticks. When you look at several fractal indicators, you’ll notice that they all have patterns that appear like an arrow. One of two things happens. Either the price increases, reaches a peak, and then declines or the price decreases, reaches the lowest point and then it increases again. Traders can learn when to purchase or sell a security by keeping an eye on these price changes.
Two major trading fractal patterns can be identified based on the description given above:
- Down or bullish fractal
- Up or bearish fractal
Up (bearish) fractal
In order for an up fractal to be formed, two candles with two lower highs must be to their right and two other candles with two lower highs must be to their left.
A visual representation of this pattern can be seen in the following chart:
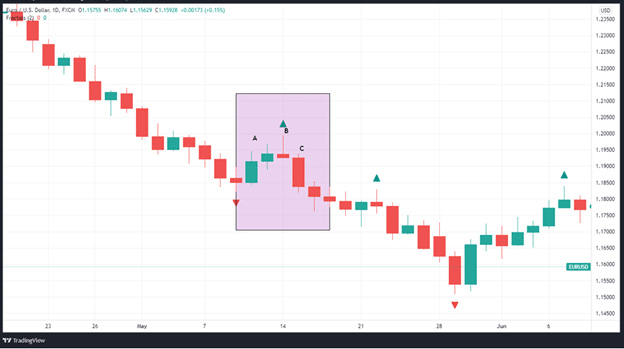
(A) To the left, two candles mark lower highs.
(B) The higher high which is the tip of the fractal pattern
(C) The right-hand candlestick has two lower-high candles.
Down (bullish) fractals
The down fractal, also known as the bullish fractal, occurs when the price has been decreasing up until some point, then it reached the lowest price and started to increase once again. The down fractal indicator in the trading chart looks like this: the middle candle of the bullish fractal marks the lowest low price, whereas the two hands on the left and on the right mark the higher low prices.
A down fractal is formed when a candle has two candles to the right with higher lows and two candles to the left with two further higher lows.
The following chart shows what this pattern looks like:
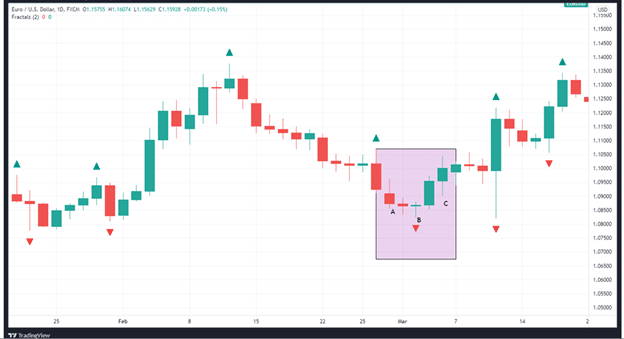
(A)To the left, there are two candles indicating lower lows.
(B) The fractal pattern is just below the lower low
(C) To the right-hand side, there are two candles registering higher highs.
Stop-loss placement using fractals
Stop-loss orders are also commonly placed by referring to fractals. One of the most common ways to do this is to place your stop loss at the most recent up fractal when opening a short position.
Investors typically utilize the fractal’s tip rather than its actual candlestick to do this, as demonstrated on the chart below:
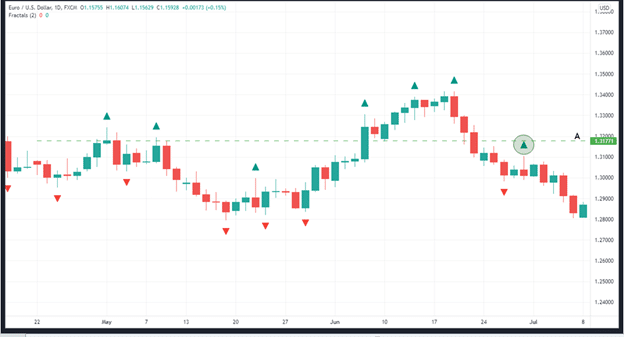
Point (A) showing a stop loss at the fractals’ tips
In circumstances where you find multiple fractals on a chart, it is advisable that you use the most recent one to place your stop loss.
To put a stop-loss order for a long position, look at the most recent down fractal, as seen in the chart below:
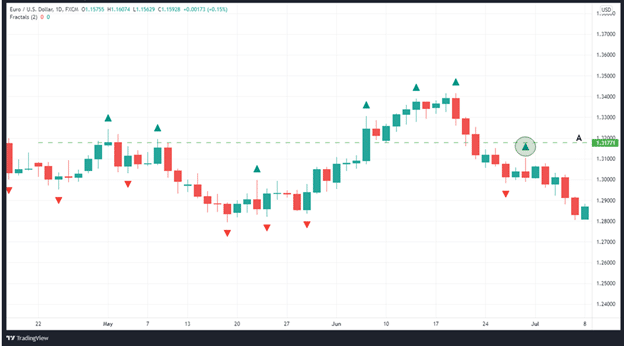
Point (A) shows the location of a stop-loss at the fractal’s tip.
In summary
In the financial markets, fractals are indicators that signal the possibility of a reversal in the markets. Five candlesticks make up the pattern, and they appear when a specific price movement on a chart occurs.
Price charts using the fractals also highlight the most appropriate levels for establishing stop losses. In essence, fractals reduce complex patterns to their most basic and predictable forms. Fractal indicators can be used to determine the direction of the market when the price breaks through the highest high or the lowest low of the pattern.


Leave a Reply