
A continuation pattern is a series of price fluctuations indicating that the current trend will resume after the break. Consolidation usually manifests itself in the shape of a sideways movement.
Reversal patterns communicate that the current market trend has reached a point of exhaustion, with a new price trajectory in the offing. For instance, if the trend has been moving upward, this should mean the trend is coming to an end, and downward action is imminent.
Reversal patterns
Double top and double bottom
The setup consists of two high points. The two tops can have the same resistance, or one can be lower than the other. The Double Bottom is the polar opposite of the Double Top in terms of appearance. There must be two bottoms, one of which can be somewhat higher than the other.
In the double top, you can confirm a reversal when the price breaks the low between both tops. In the illustration, a trigger or signal line is marked by the red line.
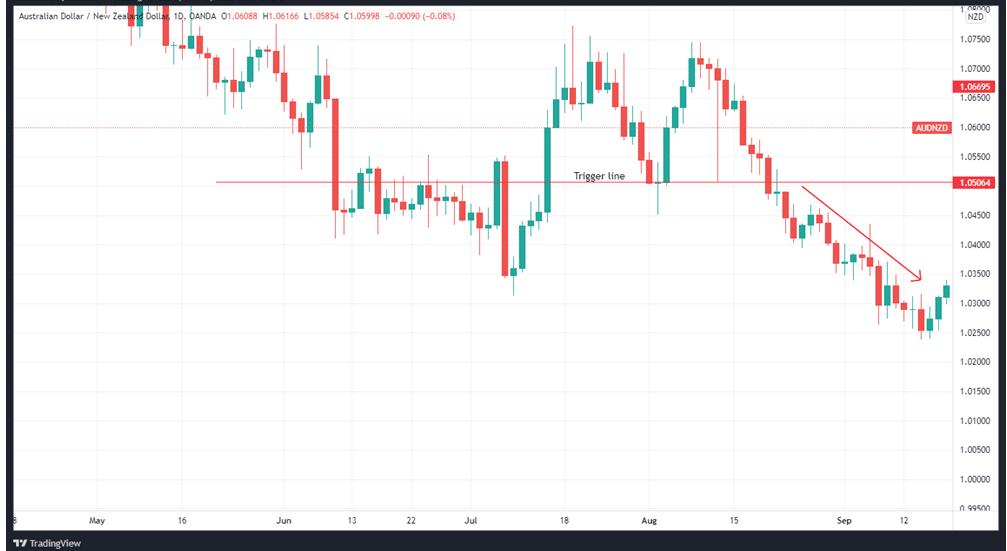
There should be a stop loss order placed directly above the second top. Distance between neck and centerline connecting two tops is a minimum target for the formation. For the double bottom, the target is the length from the neckline to the line interconnecting the two bottoms.
Head and Shoulders
The first shoulder of a top forms during an upswing, while the “head” appears after the price briefly makes a new high after the first shoulder. The head is the formation’s highest point. Second shoulder forms after another pullback. It is lower than the head.
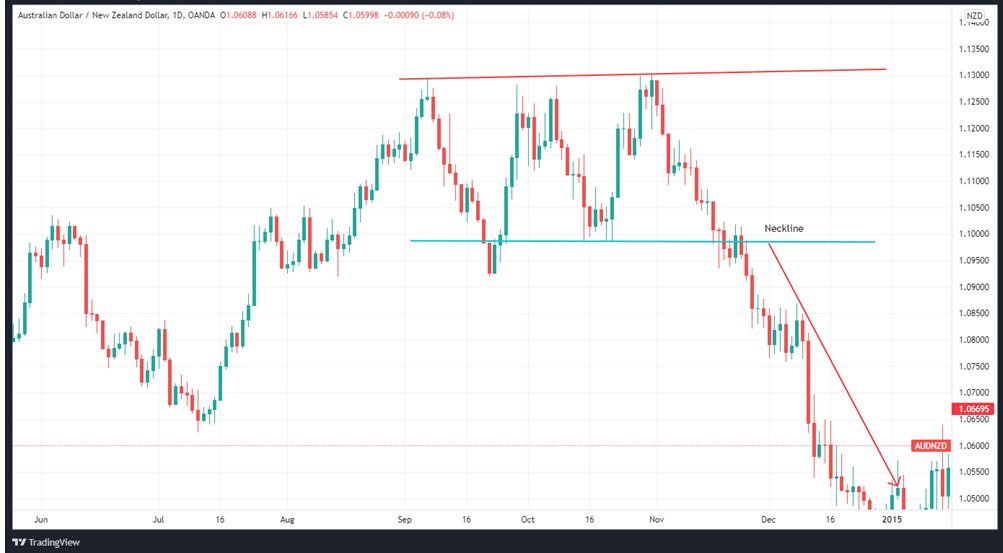
As a result, we are left with two shoulders and in the middle, we get the head. In the AUDNZD example below, we see the head at 1 and two shoulders at 2 and 3.
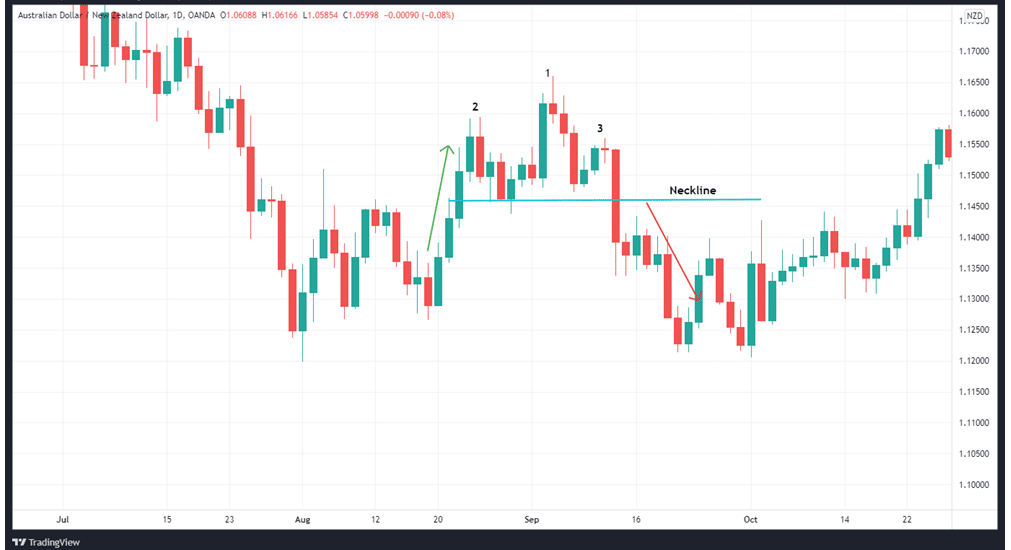
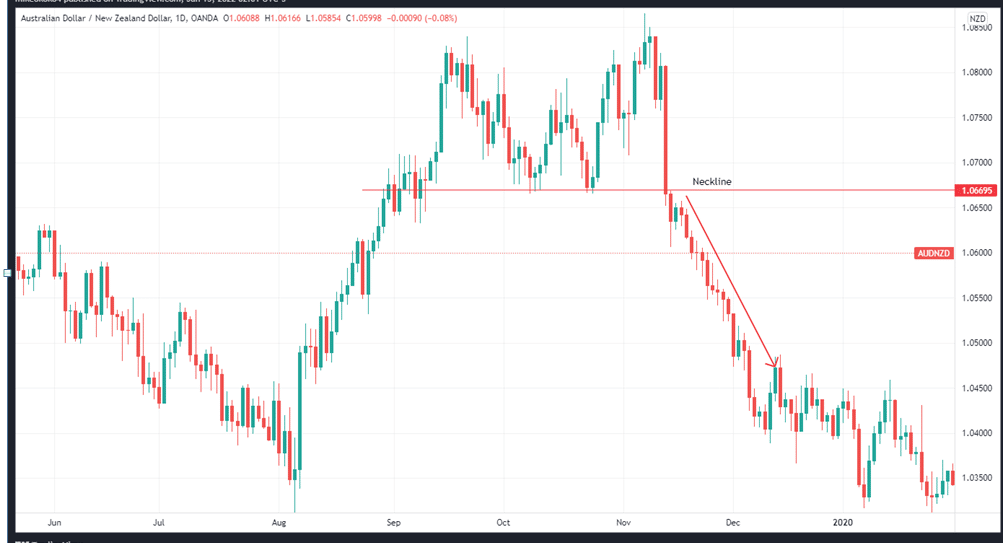
We get a vital sign of a reversal from the H&S when the market breaks through the horizontal line/neckline connecting the two bottoms on either side of it. We get a reversal signal when the price breaches the neckline. Taking a short position is the best strategy at this point.
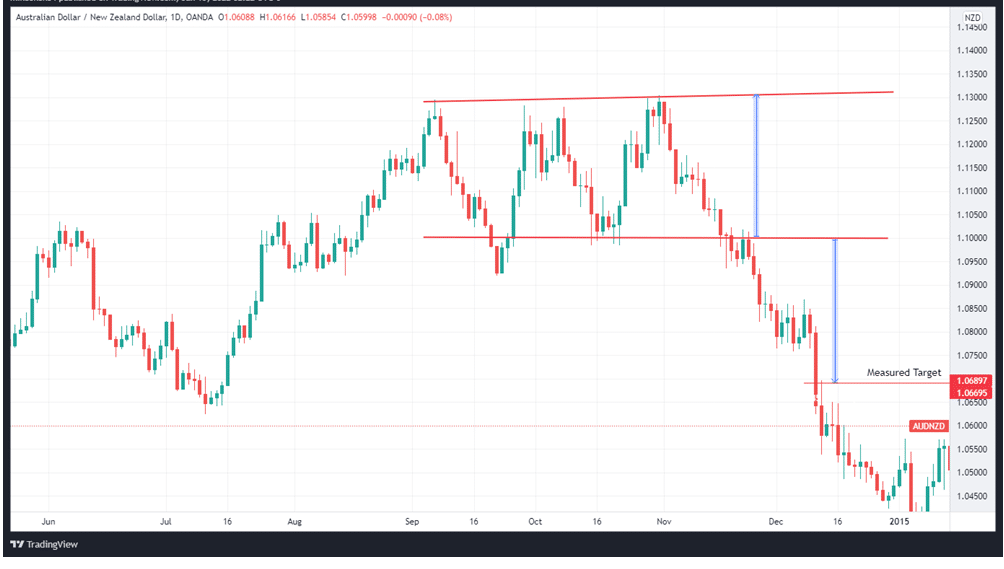
You should place your stop loss orders above the setup’s right shoulder. Then you would expect a move that was at least as wide as the space between the neckline and the top of the head.
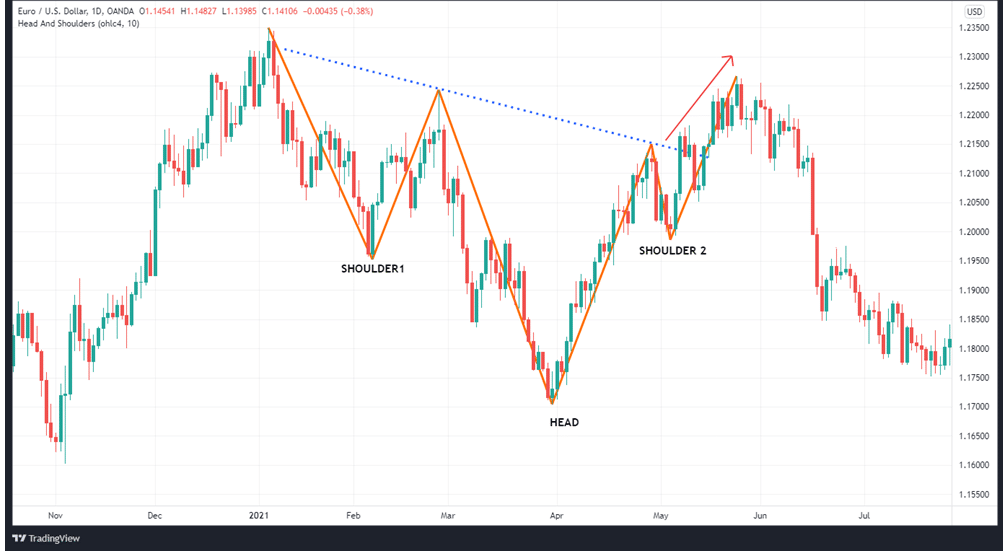
As the name suggests, the inverse H&S design is an upside-down setup variant. The formation appears after a bearish trend. The appearance of the three bottoms then transitions to a reversal of the bearish trend. It’s best to go long on this one. It’s also possible to use the same approach in finding targets with H&S to locate the target for inverted H&S.
Triple tops and bottoms
Triple Tops
The triple top setup resembles the double top in terms of its structure. It is likewise a bearish reversal, but it has three tops.
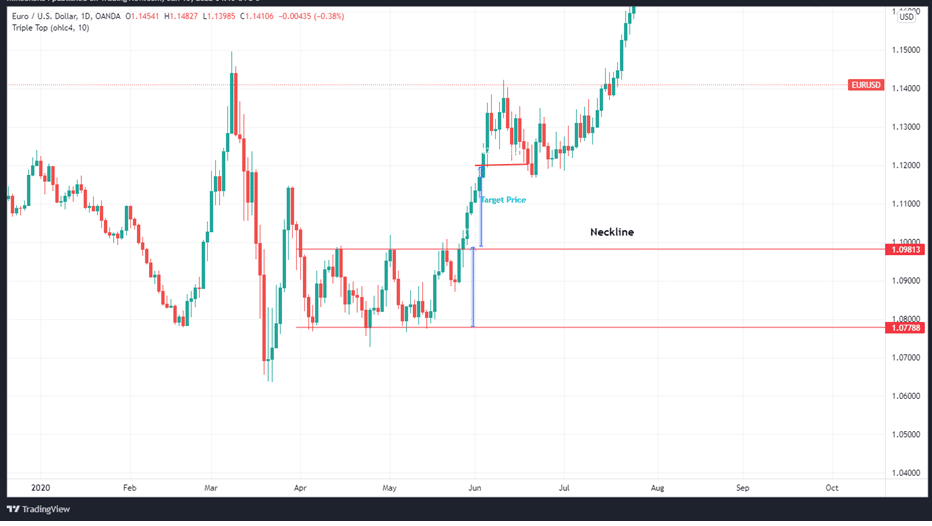
It communicates the creation of additional support as the price attempts to rise. However, it encountered resistance and fell back to the critical level. To complete the triple top reversal, we need to see price breaching this support to the downside.
In other words, this confirms that the prior upswing has been reversed. The breaching of the support shows that it is an excellent time to go short.
In order to determine your profit target, measure the vertical distance between the highest top to the lowest bottom.
You should then use that distance to extrapolate the target to the downside (see the image above).
Triple bottoms
It’s easy to see how this setup design contrasts sharply with the triple top pattern. This is a bullish reversal pattern, which indicates that the previous decline has reversed to an uptrend.
You get the price target in a manner similar to the double bottoms. To calculate the target, use the vertical distance from the lowest bottom to the highest peak.
Continuation patterns
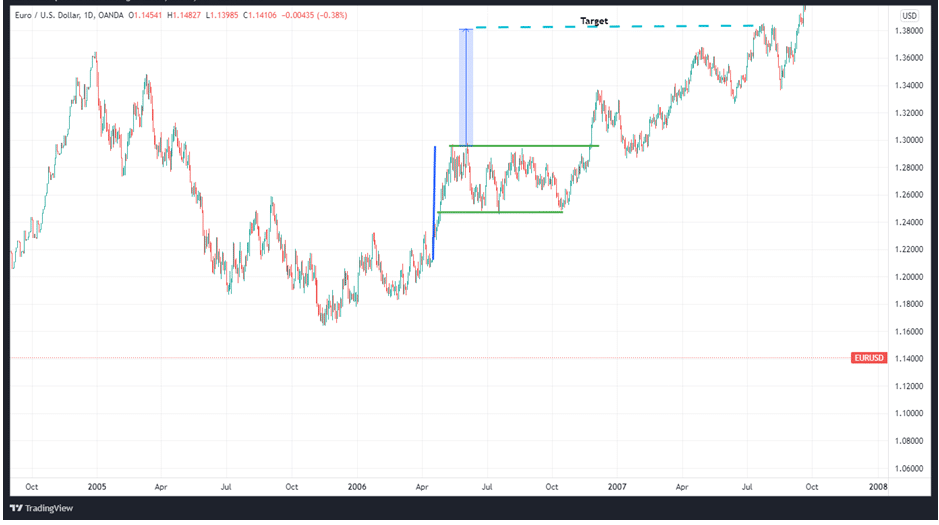
Rectangles
To gauge when the price will break out of the rectangle, look for a flagpole that appears before the formation.
We can see the rectangle-shaped continuation pattern on the EURUSD chart below as an example. Before forming a rectangle, prices had been in a downtrend. The price quickly broke out below the lower line parallel of the rectangle, indicating the resumption of the downtrend.
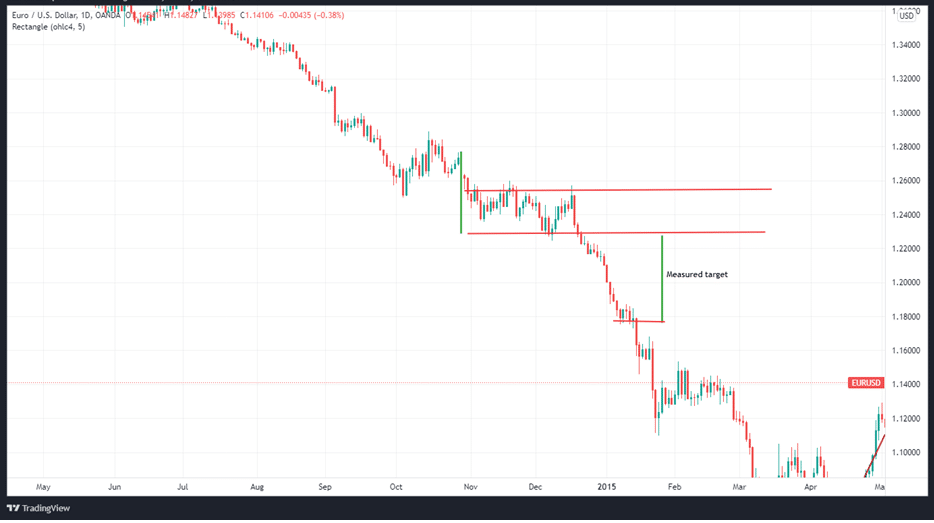
The USDJPY currency pair is now trending downwards in the illustration above. We get the target of a flagpole’s length by entering below the breakout point of the bottom rectangle line and aiming for that price.
Pennants
This formation appears when the movement between the critical levels becomes increasingly tight as time passes, and it takes the form of a flag or triangle. Generally, pennants are defined as having at least five points of support and resistance. Both bullish and negative price moves may produce pennant continuation setups.
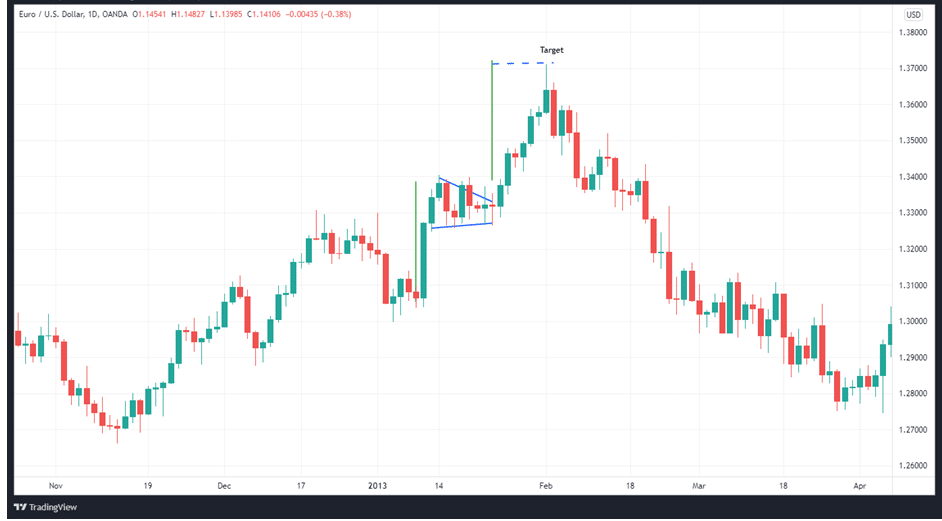
If you see a bearish pennant, it means that prices are likely to fall. As a result, after a significant decline, the bearish pennant provides a momentary respite in the downward trend, allowing prices to stabilize and sellers to grab profits.
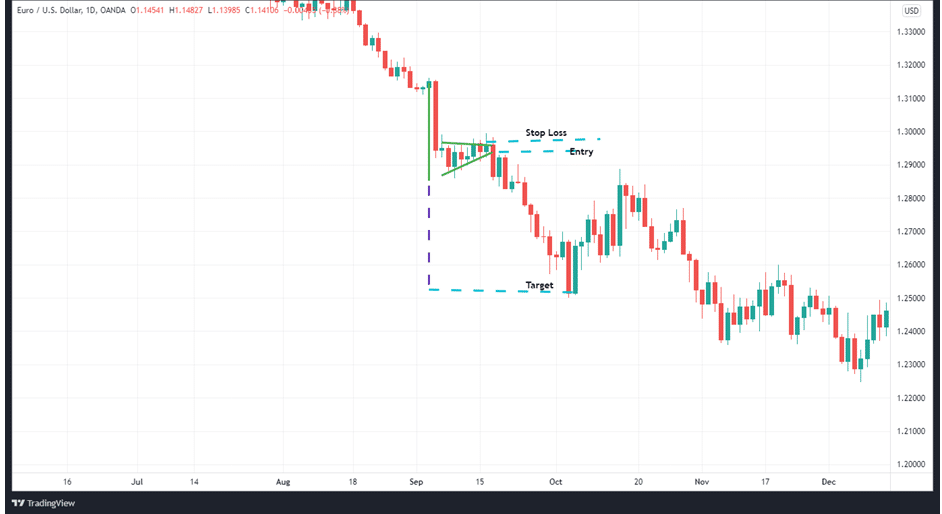
Once the pennant is broken, prices will continue to fall. A bearish pennant is visible in the image above.
Flags
Channels and flags have a lot in common. The two parallel lines that make up this continuation pattern serve as support and resistance. Positive, negative, or zero slopes are all possible. This all depends on what’s going on in the market.
In a downtrend, the flag will point up and have a positive slope, whereas, in an uptrend, the flag will point down.
The price breaking out and closing above the resistance line of the flag would be a buy signal if we were in an uptrend.
After breaking and closing below the flag’s support line, we will have received a sell signal in a downtrend.
The price plummets as it approaches the upper flag line in a bearish flag, which is the resistance. In addition, the price drops when the flag’s bottom line, representing the support, is broken.
Consequently, this is a negative signal that the price will decline once it breaks out of the flag’s lower boundary.
The opposite is true for a buy setup. A bullish flag may be seen in the image above.
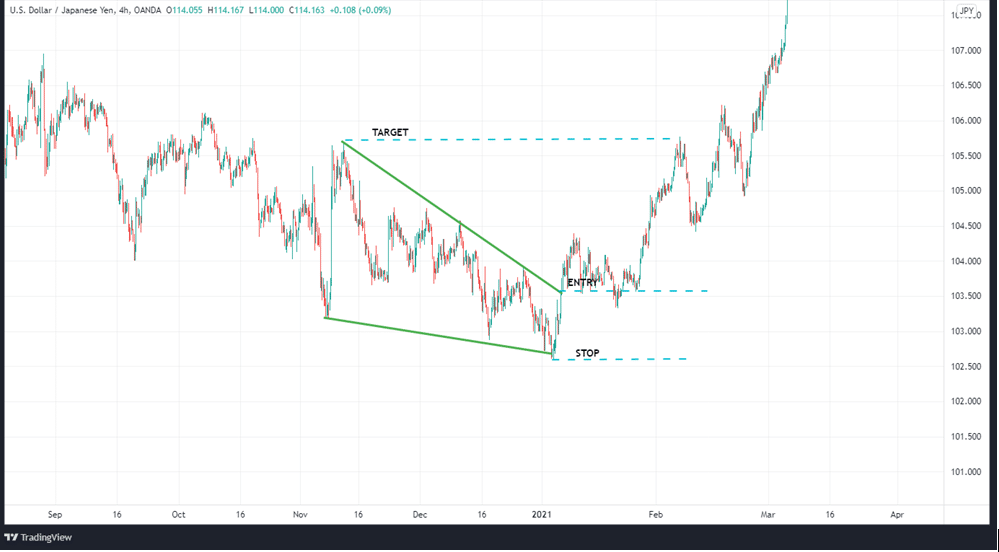
Wedges
We get a wedge in the form of two converging trendlines that connect the price series’ highs and lows.
The formation indicates a pause in the present trend. An upward-sloping rising wedge (see the image below) is a bearish setup that appears in a declining trend.
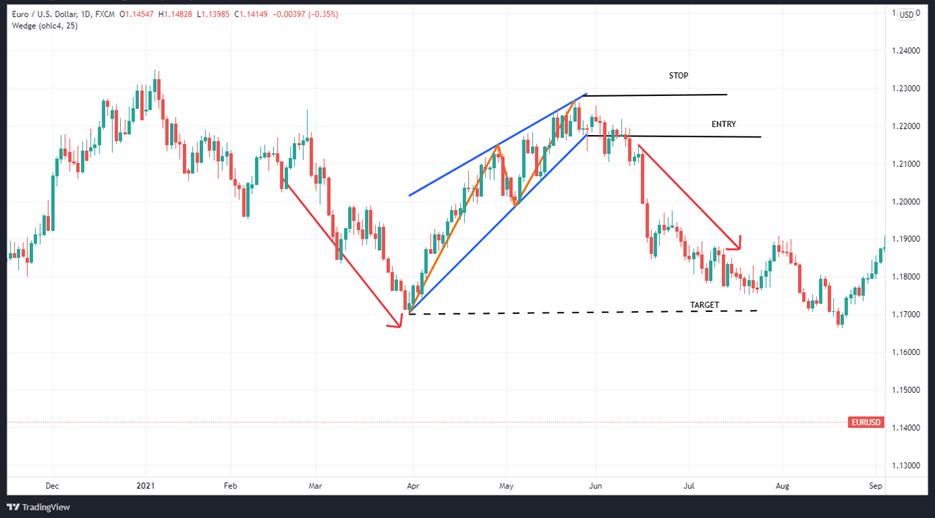
Falling wedges, on the other hand, are bullish setups with lines that slope downward.
Cup and handle
The cup and handle is a bullish continuation pattern that is named after the shape it takes.
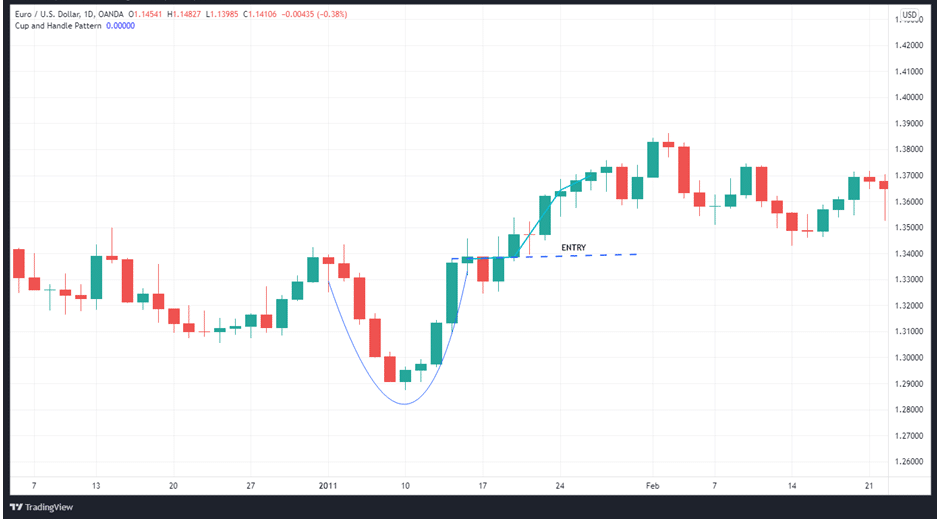
The cup section of the pattern is fashioned like the letter “U.” It’s not uncommon for the price to break out of the cup and reach a new high.
In summary
Continuation setups indicate a brief pause before re-establishing a trend towards the previous direction. Reversal signals show that either the bulls or the bears have lost power and that a shift in trend may be approaching.


Leave a Reply