
Rectangle bottoms are formed by two horizontal trend lines that oscillate in a parallel direction. This pattern is formed after prices move in a downtrend before it pulls up a short-term bullish reversal in an upward breakout. The pattern can also indicate a downward bearish continuation in the short-term instead of the upward breakout. The difference with the rectangle tops is that they begin from an uptrend of prices instead of a downtrend.
A long-term or intermediate downtrend can precede the rectangle bottom.
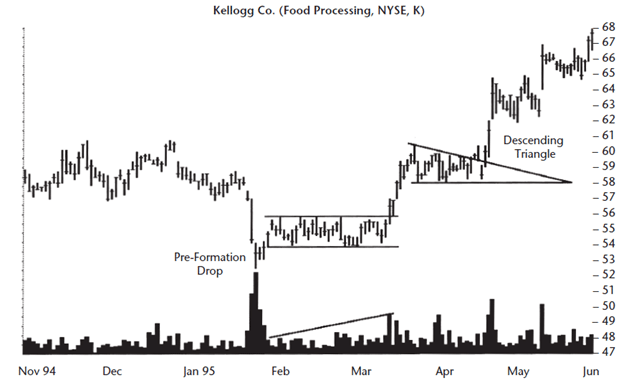
Figure 1: Rectangle Bottom followed by a descending triangle
It then forms an upward breakout, with prices forming a descending triangle as they seek stability. Afterward, the prices burst out and upwards. In figure 1, the pre-formation drop occurred at $54 when the pattern gained traction. The upper horizontal layer closed at $56 while the descending triangle reached a low of $58 after starting at $60.
In a bear market, the rectangle bottom is still formed when prices move downwards.
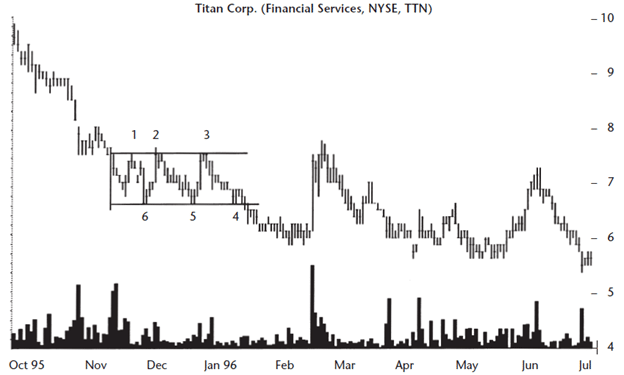
Figure 2: Rectangle bottom in a bearish market
The prices will then move out of the bottom line before retracing to the rectangle’s top line and then move lower.
Identification
- The previous trend of the security’s price before the formation of the rectangle bottom is a downtrend.
- The horizontal lines forming the rectangle bottom pattern need not be symmetrical. They depict two parallel lines at the top and bottom of the design.
- The pattern has at least four touches on the price trends (two at the top and two at the bottom). The pattern’s W-shape has to touch the horizontal trendlines in at least four sections (see figure 2).
- The volume moves downwards depending on the price volatility of the security.
It is vital to note that prices will rise in an upward breakout after traders’ buying demand exceeds the pressure to sell (Supply). The demand to buy a stock or security will increase after a company improves its fundamentals, raising the support levels, novice traders fishing the stock at the bottom, and insider buying.
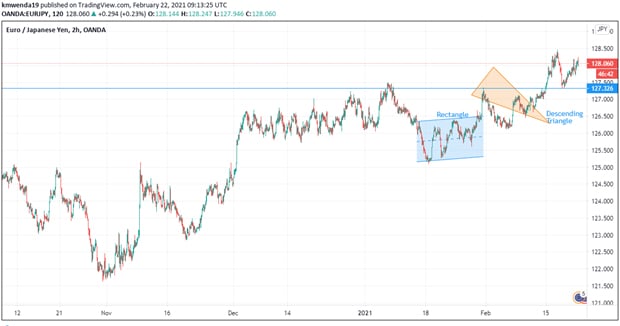
Figure 3: EUR/JPY Depiction of rectangle bottom
Figure 3 shows the EUR/JPY trading pair. The rectangle bottom appears on January 18, 2021, through 10 days to January 28, 2021. The pattern touches the horizontal trend lines at 125.115 at the first bottom position and 125.252 at the second bottom section. In the upper horizontal line, the first touch is 126.306. The second touches the trendline at 126.365 and the third at 126.543. The breakout position is seen at 127.326 while the descending triangle points slightly below 126.5000. The end of the triangle shows the new support level as the price steadily hits an uptrend at 126.498. The bullish run was slightly cut short at 128.381 before declining to 127.343.
The rectangle bottom in figure 3 shows the price trend entering the design from the top of the market. As the price trends upwards, it encounters an ascending breakout that is a reversal from the incoming downtrend. If the price trend continues to move downwards from the pattern, it forms a continuation, i.e., a continuation from the beginning decline that symbolized the pattern’s start.
Peculiar traits of the pattern
Rectangle patterns with a tall distance between the horizontal lines have a better performance than short lines. This interpretation holds in describing the trend of a bullish market. In figure 3, the intermediate distance between the two horizontal lines is 1.428 (A high of 126.543 and a low of 125.115). This height is above 1% in margin. The EUR/JPY trading pair has moved in an upward breakout, indicating that the horizontal trend lines’ height has worked positively.
A rising volume trend (shown in figure 3) gives better results than a falling volume trend in the rectangle pattern. The only difference is the pattern that forms in a bear market. The volume in this pattern may fall but still work well to interpret the downtrend in prices.
The trader will apply the breakout volume to interpret the trendline when it is heavy. In the bull market, heavy uptrends describe an upward breakout. In a bear market, the volume will show a downward breakout and a continuation pattern.
Trading recommendations
- Suppose you want to get the minimum price movement of the security measure the horizontal trend lines’ height. Add the difference to the top of the trendline to understand the upward breakout.
For the downward breakout, subtract the difference with the bottom trend line (the lower horizontal line). To get the maximum price move/target, get the rectangle’s length and add it to the top trendline to get the upward breakout. To identify the downward breakout, extend the length of the rectangle from the lower trendline.
- Before trading, wait for the breakout to move in the desired direction as the price closes outside the rectangle pattern.
- Since a tall rectangle has better performance, sell or place a short trade on the top trendline after the breakout. Buy the stock or security when it reaches near the lower trendline.
- As a trader, you will want to wait for the stock’s prices to finish their throw or pullbacks before you initiate the trade. Waiting helps you to observe whether the prices will rebound or return to the trendline.
Conclusion
Rectangle bottoms are formed when prices are on a downtrend. Prices hit a short-term bullish reversal pattern after breaking out from the rectangle bottom. The upward breakout is also supported by the descending triangle that gives the new support for the upward reversal. Increased buying activity against supply raises the price of the stock. The trader needs to assess underlying fundamentals that may push the prices, including insider trading. The rectangle bottom does not necessarily have to be at the annual low. It should be preceded by a downtrend that forms the W-shape where the trader can draw two parallel horizontal lines. A more extended pattern has a better performance.


Leave a Reply