
The goal of a breakout strategy is to profit on a large move that follows a pattern that is relatively easy to spot. Seasoned traders know the importance of being ready for several false breakouts while catching the momentum. As the name suggests, it refers to an attempt to break out of an established level that fails to go further.
Traders should be aware of false breakout patterns since they are often a strong signal that price is about to change direction or that a trend is about to resume. Since price appears to break out but then swiftly reverses, it might be considered a ‘deception,’ which deceives all those who fell for the false signal.
The logic behind false breakouts
Fake breakouts (or “fakeouts”) are more likely when inexperienced traders enter the market just when it feels like the convenient thing to do. They prefer to enter markets that are already aligning in one direction. They also attempt to utilize critical inflection points to predict breakouts when the price breaches these levels.
When price action takes the opposite direction, it triggers several stop-loss orders, trapping these traders. As more people become aware of what is going on, they enter the market, exerting more pressure on the price.
When you employ a strategy based on a fakeout, you have to interpret the market psychology correctly. You have to ignore what a few candlesticks say and concentrate on the bigger picture. This involves knowing the current sentiment and prevailing fundamentals. You may also need to employ technical indicators to confirm your setup’s validity.
False breakouts often result from the first reaction becoming a new trend that runs in the exact opposite orientation of the original direction. In the AUDUSD daily chart below, we see a false breakout above the resistance level at 0.9373.
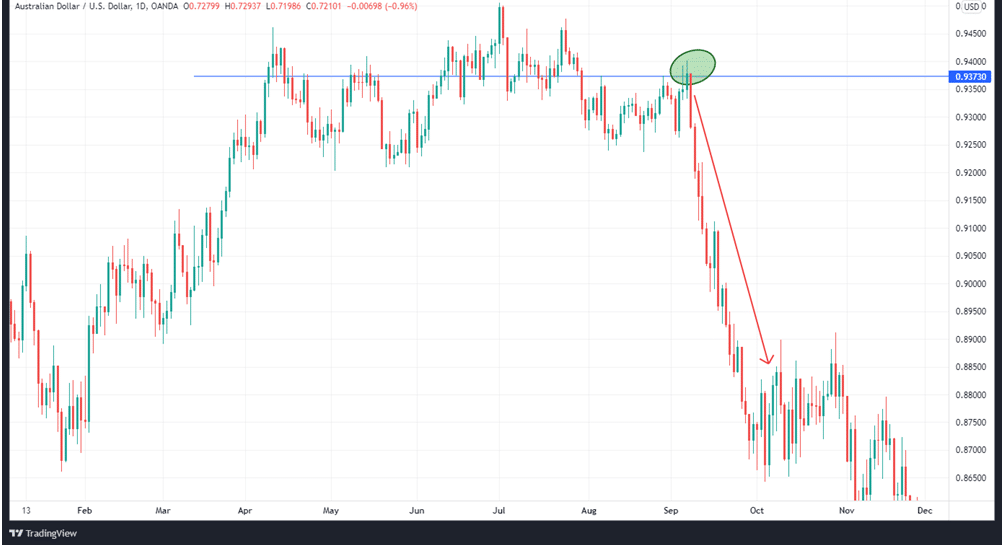
However, the upward breakout fails at the point highlighted in the green ellipse and the price reverses downwards.
Identifying a false breakout
It’s true that spotting a phony breakout is never a simple task. Instead of getting sucked into a situation like this, use one of the methods below.
Use different timeframes
You can look at different timeframes in an effort to spot fakeouts. If you detect a breakout on a four-hour chart, for example, you should zoom out to a daily or weekly chart to get a better sense of the entire trend.
False breakouts occur when the price falls in a shorter time frame but not in a longer time frame.
The percentage rule
For starters, depending on your trading plan, you’ll want to give it a few days or hours to see if you are dealing with a genuine breakout. Despite the fact that this may appear to be unhelpful, it will help you prevent losing money in the event of a fakeout.
When using the percentage rule, traders make sure that the price has risen a certain percentage over the resistance level or fallen by the same margin below a support level before declaring a breakout as complete. The percentage will depend on the volatility of an asset and the timeframe.
False breakout trading strategies
Setting profit targets
Breakouts on low trading volume often transition to a rise in volume during and after the reversal.
Because of this, you should keep your position open until the volume picks up. If you notice a decline in volume, it may be time to terminate the trade and take your profit if the price move is nearing its end. Always keep a watch on the price action while at it.
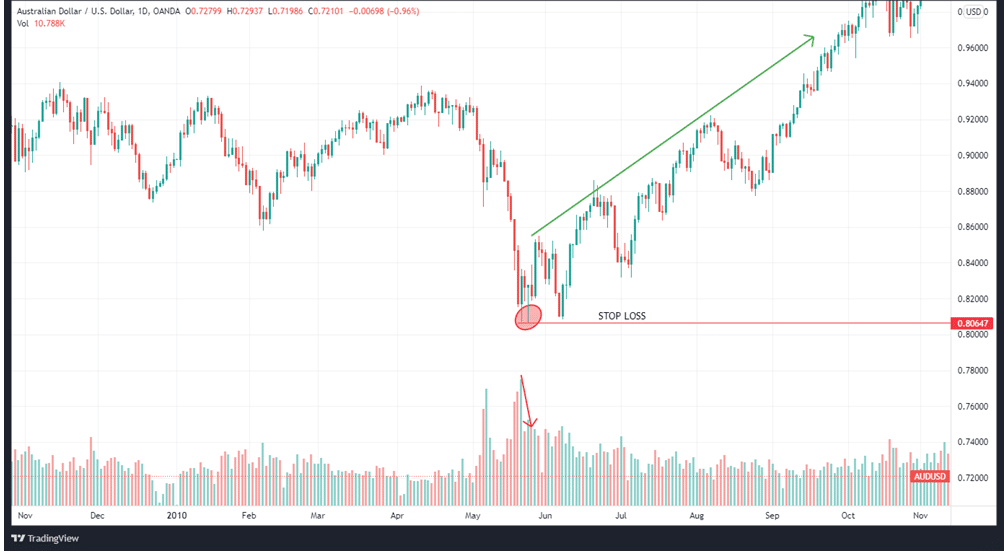
You can see the AUDUSD daily chart above, where we use the volume indicator to assess the validity of the breakout. The price breaks out towards the downside, as seen on the chart. However, the falling volume at the point at the red arrow on the volume indicator does not support the breakout. Therefore, we put a stop loss beneath the breakout and go long. The breakout proves false and the price assumes an uptrend, resulting in a profit.
As standard practice, don’t forget to employ a Stop Loss order. That is because even if the price stays above the support level, it’s impossible to know if it won’t fall again.
Stop loss
Trading fakeouts entails significant risk management due to the high degree of volatility that often surrounds these situations. When there are signals that the breakout is legitimate, you can utilize false breakouts to test a crucial level and then proceed to set up a trade in the direction of the original breakout. As a result, you should always use a stop loss order to safeguard your trade.
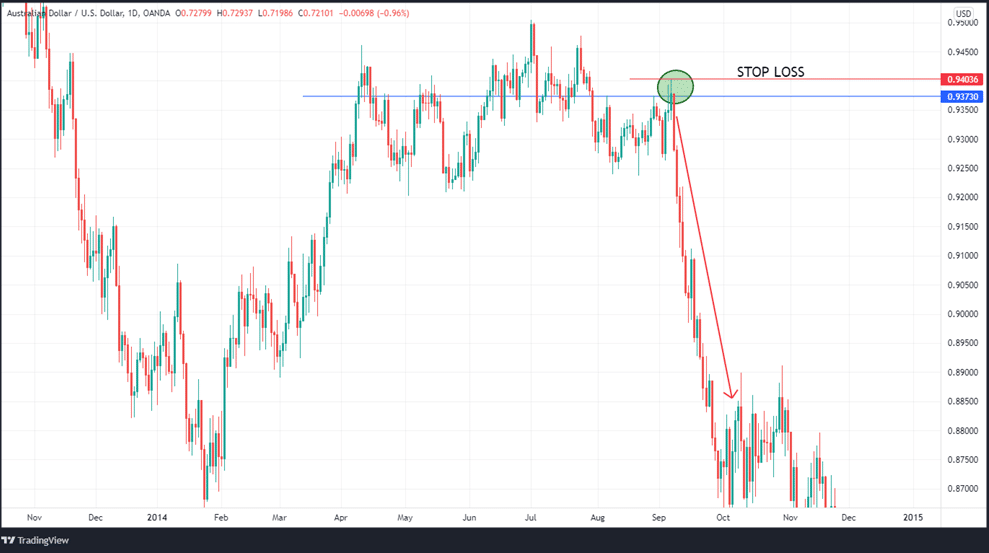
As you can see on the AUDUSD chart above, the best place for your stop loss is at the peak of the initial breakout.
Entry
When trading fakeouts, the good timing of your entry is essential to the setup’s success. To get in on the action when the price retests an important level after breaking out, you need to see a breakout with low or falling trading volume. A false breakout is likely to emerge if the momentum strengthens further following the break.
If the price breaches a critical level in a bullish trajectory on low volume, you may want to consider shorting the Forex pair on the ensuing bearish pullback. If the price breaches an important level on low volume in a bearish condition, you may want to consider buying the currency pair on a subsequent rise.
In summary
In the financial market, false breakouts/fakeouts are common. Traders who aren’t familiar with them are likely to lose a lot of money whenever this happens. The challenge of finding these breakouts is, unfortunately, not straightforward.
However, it is possible to minimize making these mistakes by following the solutions we have provided. Contrary to popular belief, you should not trade on every breakout. Before executing a trade, look for divergence on an indicator to see which offers the most profit potential.


Leave a Reply