Volatility is an important element when trading in financial markets, as it reflects the price variation of the market over a particular period of time. Volatility indicators can be used by traders to show the magnitude and size of the price fluctuations of any particular instrument. Volatility can change in an instant in the currency market, depending on a number of factors. For instance, markets tend to become more volatile when there is fear or panic in the market. However, by using volatility indicators, one can get knowledge of the historical volatility of a market. Armed with this knowledge, traders can implement them in various trading strategies as it provides a better idea if how prices behave during times of extremely high or low volatility.
Keltner Channel
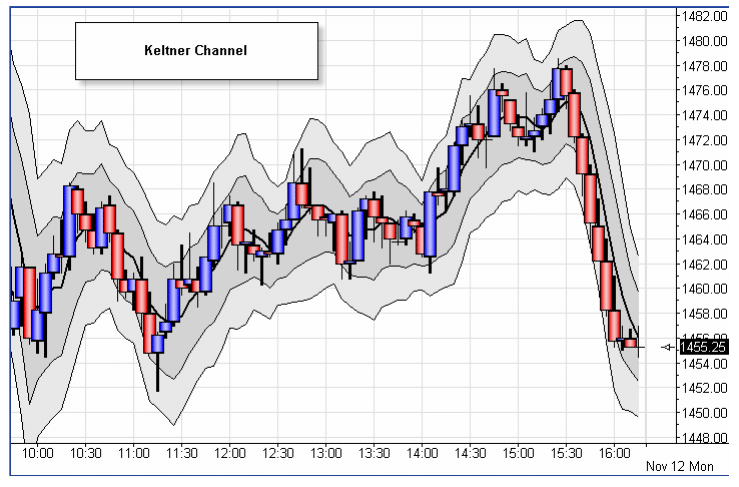
The Keltner Channel is a volatility indicator that analyses price movements that are relative to the upper and lower moving averages of forex pair. It consists of two band lines around the moving average line. The distance from the moving average line is calculated based on the True Range of each bar. The True Range is added or subtracted to the moving average line after being averaged over “N” periods. It is then multiplied by a multiplier number for adjusting the band distance. If the true range values are small, the band distance becomes narrow, indicating low volatility. Consequently, the band distance increases in volatility in wide-ranging markets. As a trader, you should wait for the price to penetrate either the upper or lower channels as it indicates the likelihood of a continuation of a trend. In an upward trending market, rising prices create a rising channel. A strong bullish signal is indicated is triggered if the price breaks above the upper band.
How you interpret Keltner Channels will ultimately depend on the prevailing market conditions. There no doubt that price is weaker at the lower band while being strong in the upper band. However, depending on whether the market is trading in a range or is experiencing a strong trend, you can use these points as separate entry signals.
Chaikin Volatility
The Chaikin volatility is another volatility based indicator which is popular amongst traders. By looking at the difference in the Exponential Moving Averages of the high and lows of the last 10 bars (default), the indicator measures volatility and alerts the trade to a sudden increase in the daily price range. If you get a high indicator reading, you can use it to confirm the likelihood of a breakout or reversal.
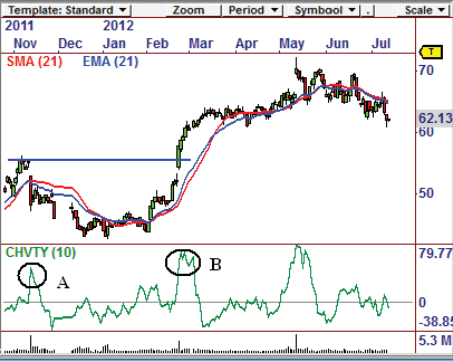
If we take a look at the above chart for Dillards, we can see two examples. An unusual Chaikin Volatility reading can be found at point A, which accompanies a reversal. The resistance level where the security was once volatility began, is also marked. Such situations can alert you to a high probability of a break in either direction.
At point B however, we see that the higher indicator reading results in a breakout instead of a reversal. This is a perfect example of the usefulness of this indicator. To increase the odds of entering a profitable trade, use this indicator in conjunction with other indicators from a different class.
Bollinger Bands
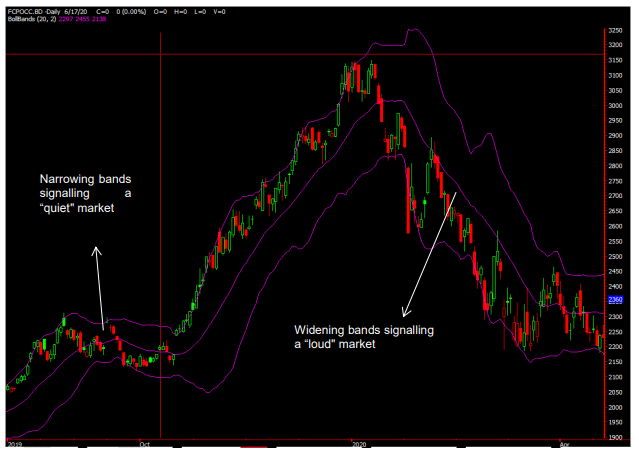
Bollinger Bands are a useful and well-known indicator that was developed back in the 1980s. It is made up of a 20-day simple moving average, and two bands being placed 2 standard deviations away. Bollinger bands are the perfect vehicle for measuring volatility, capable of capturing 90-95% of a security’s price movement.
You can use Bollinger bands to gauge the loudness of the market by studying the band’s wideness. Narrower bands indicate that market is quiet and stable while wider bands are an indication that the market is volatile. You can also use it in various strategies such as riding the Bollinger bands trend, Bollinger Bands reversal, and Bollinger Bands breakout. It’s a flexible indicator which allows traders to quickly use standard deviations on their own. It can be used on almost everything from volume to sentiment data.
Average True Range
The ATR (Average True Range) is often used as an indicator, but it is a bit different from other indicators. It is not necessary for ATR to predict anything. However, ATR indicates changes in the stock’s movement with extreme activity. Higher ATRs indicates a stock that is trending while lower ATRs are an indication of the price consolidating. Regardless of whether the stock trends high or low, the range is positive at all times. It is because we calculate true range as an absolute value, which means that we need to subtract the smaller price from the larger and it always assures a positive number.
J. Welles Wilder used ATR as the base of his volatility system which we know as ‘Parabolic stop and reverse’ (SAR). It is a trend-following system that produces a rounded curve and generates entry and exit signals by using a trailing stop. You can find SAR on the large charting websites as a common indicator. The initial stop of SAR is placed far away from the entry point and it allows a specific amount of leeway so the trade is developed. When the stock advances later and becomes profitable, the stop is recalculated constantly and becomes tighter. Thus, even a profitable trade is allowed less volatility, and the traders have to suffer loss. You need to be concerned about this if you want to benefit from volatility while trading with the ATR indicator.
Conclusion
In technical analysis, an often overlooked aspect is volatility. Volatility indicators help us measure a security’s movement, alerting us to the instances where the movement is abnormal. This is done through contraction or expansion. Furthermore, it also assists us to identify potential breakout moves and in the determination of market tops and bottoms.
Adding a volatility indicator to your technical analysis can help you isolate situations where a continuation or reversal will likely happen. However, it’s difficult to construct an appropriate and profitable trading system, using only volatility indicators exclusively.


Leave a Reply