The foreign exchange market remains the most challenging yet most exciting and profitable financial market. For starters, navigating the labyrinth of information and strategies in the market could be exasperating. Fortunately, experts have developed tools such as indicators with which forex market navigation is easier. The Keltner channel is one such indicator.
What is a Keltner Channel?
The Keltner channel is one of the best forex indicators if you wish to track the volatility of currency pairs. Similar to news trading and trend trading, volatility trading prioritizes the signals submitted by the volatility in the price action of a currency pair. For starters, volatility refers to the rate or the pace at which the price action of a currency pair changes direction. An asset whose price action changes direction fast is highly volatile.
In the 1960s, Chester Keltner developed an ingenious method with which users could formulate winning strategies in the forex market. Chester’s formula for developing the channel relied on simple moving averages (SMA) strategy. Later, enthusiasts tweaked the indicator such that it relied on the average true range (ATR), which is more accurate.
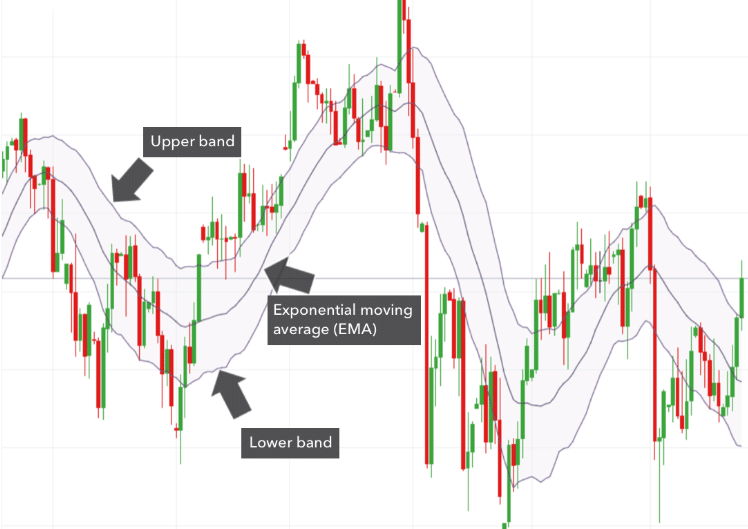
The present day Keltner channel, similar to Chester’s Keltner channel, has three lines. What is different between today’s Keltner channel and Chester’s is that the outer bands (which form the channel) are developed from the ATR, not the SMA. Figure 1 displays a fully labelled Keltner channel.
Using the Keltner channel indicator in MT4
Unlike indicators like Ichimoku charts that come pre-installed in the MetaTrader 4 (MT4) platform, users need to download the Keltner channel indicator and install it manually. MT4 is one of the most used platforms in forex because of its simplicity and robustness. Besides seamless integration of indicators, MT4 allows for easy and fast integration of forex expert advisors. As such, you can use the platform for manual trading as well as automated trading.
Step 1: Download Keltner channel indicator
The MetaQuotes ecosystem has a legion of developers who create sophisticated indicators and FX expert advisors for fellow traders. Some of these tools are free and some need payment to use. Fortuitously, the Keltner channel is available free of charge.
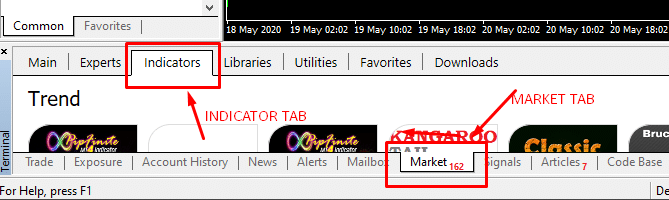
Access the MQL platform and download the indicator. Alternatively, you can download the indicator within the MT4 platform under the “Market” tab then open “Indicators” tab.
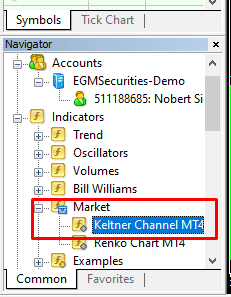
Once downloaded, the indicator will appear under the Market label in the Navigator window of your MT4 platform.
Step 2: Drag and drop the indicator on the chart window
Similar to all other indicators, users only need to drag the Keltner channel and drop it on the desired chart. On dropping the indicator, the window in Figure 4 will appear. In this window, you can adjust the parameters such that they suit your strategy.
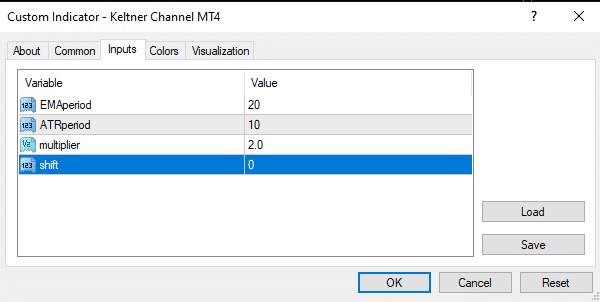
Just double click on the item you wish to customize and enter your preferred value. However, beginners are better off leaving the values as they are and only customize them when they have gained sufficient experience.
Step 3: Apply the indicator on the chart
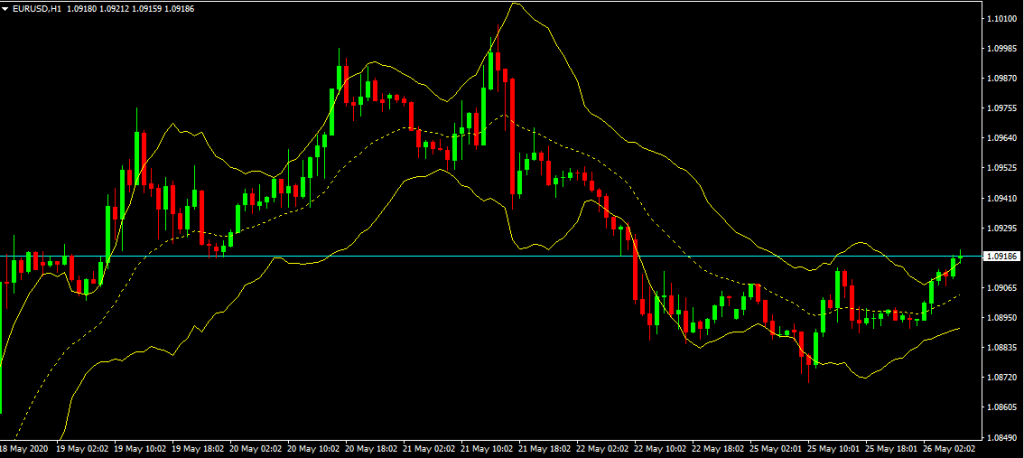
Once satisfied by the parameters click OK and view the indicator superimposed on the price chart. The indicator appears as in Figure 5. Notice that the midline (the EMA) is broken while the outer bands are continuous.
Reading the Keltner channel
You will notice that the Keltner channel has an uncanny resemblance to Bollinger Bands. While both indicators are ideal for determining entry and exit points as well as determining price targets, the Keltner channels are smoother than Bollinger Bands. This implies that Keltner channels are more responsive to price action compared to BB.
In Figure 6, the upper band and the lower band act as bounds or support and resistance levels. As such, the indicator is signaling you about a change in the trend when the candlesticks break out of the bands.
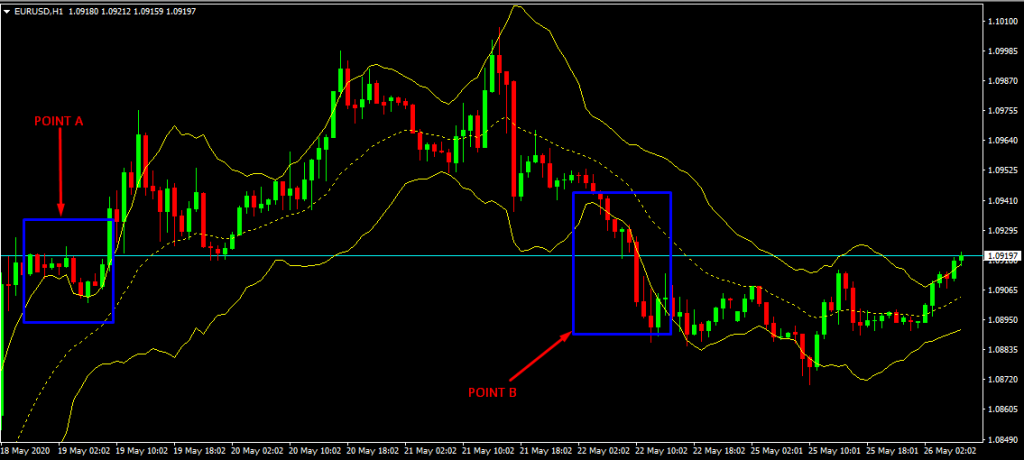
At Point A, the candlesticks are above the upper band and this tells you that the market is bullish (in an uptrend). Notice that the uptrend continues for almost five days with a breakout at Point B. At Point B, the price action is weak and the trend breaks below the lower band.
Therefore, the market is in an uptrend when the price breaks above the upper band. In addition, the uptrend is strong when the price continues to stay closer to the upper band. On the contrary, a break below the lower band indicates a downtrend. If the price stays closer to the lower band, then the bearish trend is strong.
Besides indicating trend direction and strength, the Keltner channels show overbought or oversold conditions. In an overbought market, the price appears stuck closer to the lower band. Conversely, the market is in an oversold condition when the price appears stuck on the lower side of the channel.


Leave a Reply