Most beginner traders look for a single indicator that can help them make big profits. They may find one that helps them make profits but as soon as the losses come in, they look for another indicator. This is the wrong way of approaching indicators since none of them is designed to provide a flawless market prediction.
They are not even designed to correlate with each other. Instead, they are meant to be used in combinations, while complementing other indicators, even in situations when they contradict each other.

Developed by Dr. Alexander Elder, the Triple Screen Trading System utilizes multiple indicators to filter out opposite trading signals for the same market. In this article, we go through this system in detail and explain the indicators that are used in this system.
The working of Triple Screen Trading System
The ‘triple screen’ approach developed by Elder combines multiple indicators and filters out the disadvantages associated with them without sacrificing their strengths. This allows traders to use a three-tier approach when making a trading decision.
To use this system, traders first decide the time frame. Whatever the chosen timeframe may be, there will be two more timeframes related to it – a higher timeframe, which provides a broader context of the market; and a lower time frame that provides a close-up view of the situation, thus giving you the chance to pick a precise entry point.
- First Screen
This is a long-term time frame that is used to recognize the bigger picture. This is where traders look to develop a bias. But, in order to recognize the trend, we have to utilize a trend-following indicator such as the MACD indicator.
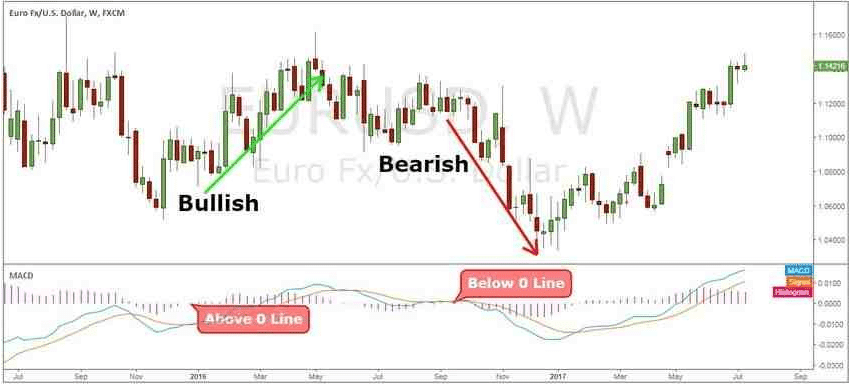
The MACD indicator can be used to read the trend in the following way:
- Bullish trend if MACD histogram is above zero lines
- Bearish trend if MACD histogram is below zero lines

A trader can use whichever trend indicator that s/he might feel is appropriate. But, the first screen identifies only the direction of the trade in which you will be trading. This means that you can only buy if there is an uptrend and sell if there is a downtrend.
- Second Screen
The second screen is the daily chart of the Triple Trading System. As soon as the direction of the tide is known, we look for a daily swing in the contrary direction of the weekly chart to provide us with a beneficial entry. Let us take for example that we are looking at the daily chart as the intermediate time frame while the weekly chart tells us that the larger trend is upward.
Now, we are looking for a daily decline that would give us the opportunity to buy the market. This is done by searching for a buy signal using oscillators to spot overbought and oversold conditions. Therefore, if we have a Bullish weekly chart, the system will focus on the bearish retracements on the daily chart only, looking for oversold conditions.
- Third Screen
As soon as we get agreement from the first two screens – that is, there is an uptrend and an intermediate decline has produced a buy signal or there is a downtrend, and intermediate rally has produced a sell signal – we move to the third screen. This screen is unique in that it determines the precise entry point using the trailing stop technique.
If the aim is to go long in the market on the second screen, you should use a trailing buy-stop a tick above the previous day’s high. On the other hand, if the aim is to go short, you should use a trailing sell-stop, a tick below the previous day’s low.

Let us assume that there is a weekly uptrend and that the intermediate decline has issued a buy signal. Here, you would be looking to place a buy stop a tick above the previous day’s high. If the market hits your stop in the uptrend, you will go long. If it declines, the stop will be deactivated. Then, you will trail your stop and drop it a tick above the previous day’s high. Keep trailing until there is a change in the direction of the weekly trend.
Indicators used in Triple Screen Trading System
In the field of technical analysis, it is well understood that trend-following indicators don’t perform well if the market is bounded and oscillators don’t work well in trending markets. This is because oscillators perform well in range-bound markets and trend-following indicators are suited to trend markets.
However, the Triple Screen Trading system combines oscillators with trend-following indicators in such a way that it benefits from their strengths while getting rid of all their disadvantages.
Some of the recommended oscillators that would work well with the system are as follows:
- Force Index
- Elder-ray
- Stochastic Indicator
- Williams Percent Range Indicators
- Relative Strength Index
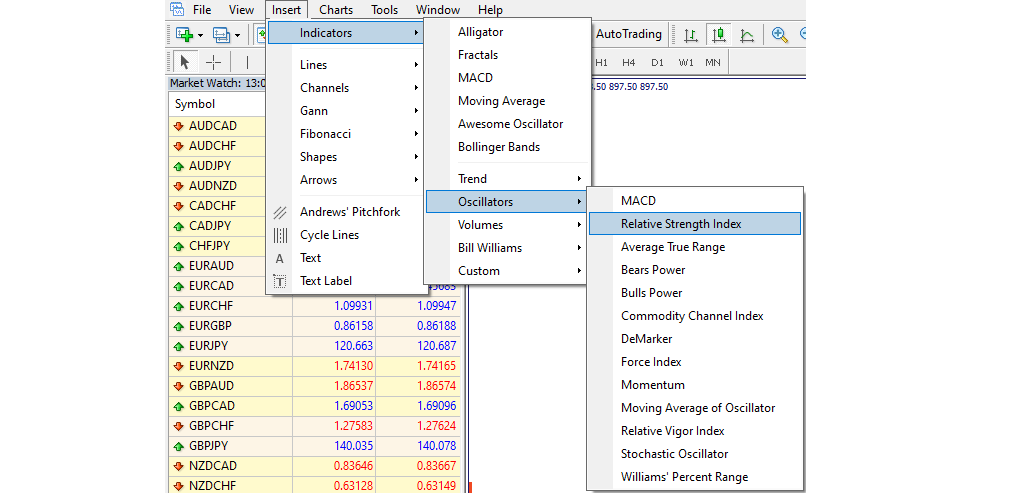
Relative Strength Index (RSI) can give a fairly precise indication of the market strength and times when it is safe to open position.
Adding RSI to the chart window is given below:

Conflicting signals can be a challenge to interpret since a trend depends on the time-frame of choice. For instance, there may be an uptrend in a daily chart but a downtrend in a four-hour chart. This challenge is resolved with the Triple Screen Trading System that forces the trader to consider all three trend lengths. The long-term trend is also called ‘the tide,’ the intermediate is also known as ‘the wave,’ and the short-term trend is also referred to as ‘the ripple.’
Choosing the time-frame is also an important factor. This system was designed initially to use daily charts for the intermediate time frame. But, this can be changed as per preference and the time-frame you are aiming to trade with should be the intermediate trend. The long-term trend is of a greater magnitude and provides an overarching view to the intermediate frame on the chart.
Let’s assume that you are looking to trade on a daily chart. Then, the long-term trend would have a weekly chart while the short-term trend would have a shorter magnitude.
Closing Thoughts
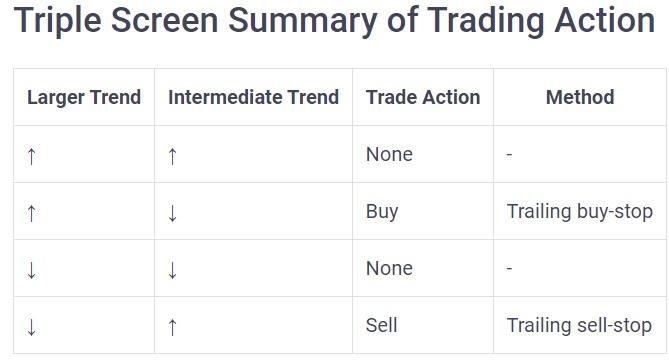
The Triple Screen Trading system utilizes a combination of indicators and multiple timeframes. Furthermore, it also uses a tight stop-loss to implement discipline with money management. Here is a table to summarize the action that a trader should take depending on the combination of the intermediate and the larger trend.

At its core, the Triple Screen Trading system is a trend following system. This is because following the trend is its basic trading principle. The first two screens help you understand where the market is headed, while the third screen allows you to time your entry better. The Triple Screen system can be applied to different time frames depending on your trading style.
Traders should realize that there is no single perfect trading methodology. Although there will be specific situations in which certain methods are applicable, the trader must understand when this trading strategy would be inapplicable. But, the basic idea is to use several filters to come to a decision and multiple indicators to make your trades.


Leave a Reply