Technical and fundamental analysis are the most widely known evaluation strands in virtually all financial markets, including cryptocurrencies. However, a third avenue that’s not explored enough is sentiment, which can sometimes explain price movements that technicals and fundamentals cannot.
Many experts believe that most of the moves we see on the charts result from human psychology or emotions. There is generally a collective attitude that market participants follow when trading or investing.
As the old Wall Street adage says, the financial markets are driven by just two emotions: fear and greed. To constantly measure these powerful emotions requires a reliable sentiment gauge.
In this case, the main way we are referring to is the Crypto Fear & Greed (FGI) Index, the primary sentiment tool for digital currencies. The most commonly used version is the one published daily by Alternative.me.
So, let’s explore how this index works and how it can be significant for crypto traders or investors.
What is the Crypto Fear & Greed Index?
The job of any market-related index is to take several data points to produce a single statistical measure. Hence, the FGI analyses different data sources that are influential to crypto prices and comes out with a number ranging from 0 to 100.
The FGI was inspired by the Fear & Greed Index developed by CNN Money. Similar to its predecessor, readings from 0 to 50 suggest fear, while those from 50 to 100 indicate greed. In some instances, an exact result of 50 may be taken as a neutral sign.
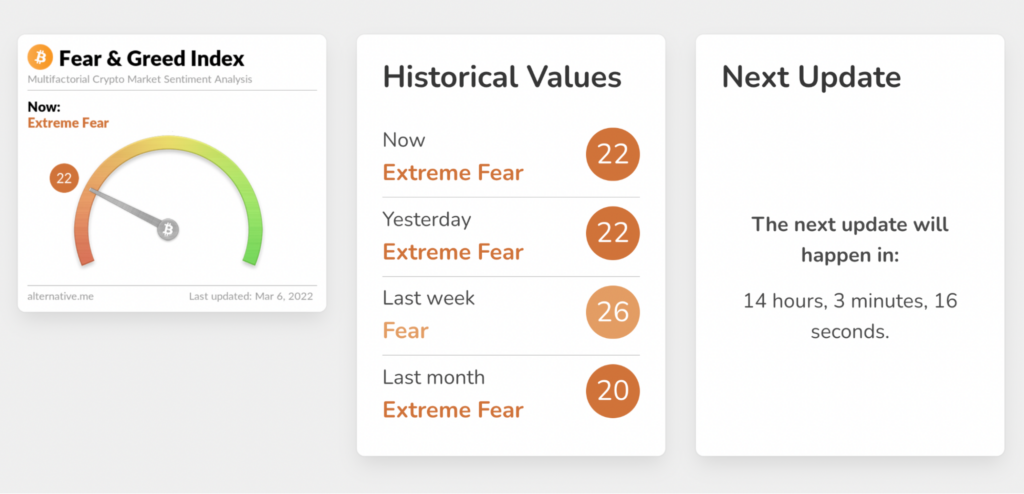
Alternative.me’s FGI breaks it down further where scores from 0-25 and 75-100 are seen on the extreme side of fear and greed, respectively. Below is the latest index reading with historical values:

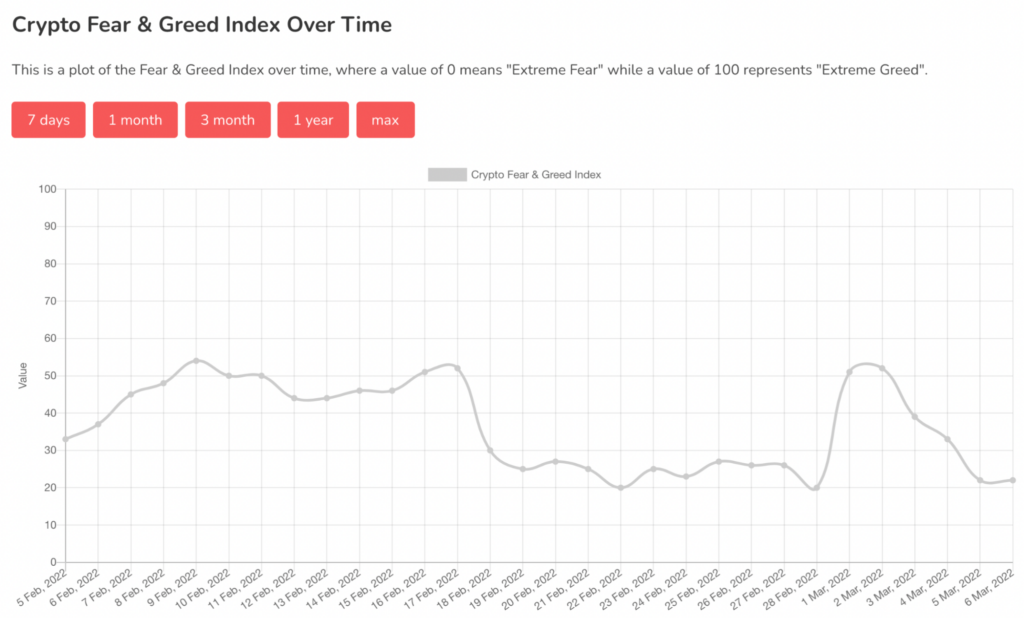
Furthermore, the website shows an image of the FGI values over the last week, month, three months, and year (as far back as January 2018). Analysts can use this data and plot it with the price movements on the charts.
The example below is the readings over the past 30 days.

The FGI is based on the simple principles below.
- When there is fear, prices keep rising, leading to FOMO (fear of missing out). It is also a sign that investors are worried as more people invest in digital currencies. Therefore, this could lead to buying opportunities.
- When there is greed, the people who bought when prices were low begin to take the profits off the table, leading to a market correction. Of course, this might suggest selling opportunities.
How the Crypto Fear & Greed Index is calculated
It’s worth noting that the FGI primarily uses Bitcoin-related data. However, because the vast majority of cryptocurrencies, especially large-capped coins, mimic BTC’s performance, it is a relatively accurate representation of the crypto market at large.
It is natural to assume that other prominent altcoins like Ethereum, Binance Coin, and Solana will eventually have their own dedicated indicators. The index looks at five distinct weighted factors: volatility, volume (50% of the FGI), social media, Bitcoin dominance, and Google Trends.
- Volatility (25%): The index considers present volatility and drawdowns and compares it with averages over the last 1-3 months. It pays particular attention to any unusual rises (suggesting fear) or declines (suggesting greed).
- Volume (25%): The indicator also looks at Bitcoin’s current trading volume and momentum and correlates it with 30 and 90-day average values. An uptick in volume may indicate greed, and vice versa for fear.
- Social media (15%): Here, the index observes the interaction rates of Twitter hashtags relating to Bitcoin. If more people are tweeting about the coin than before, the site believes this corresponds to greedy behavior and vice versa for fear.
- Bitcoin dominance (10%): This relates to the market cap share of the overall crypto market, which belongs to Bitcoin. A shrinkage in Bitcoin dominance understandably means investors are investing more in altcoins, resulting in greed.
Conversely, investors become fearful when they buy more into BTC because of its status (albeit contentious) as a safe haven.
- Google Trends (10%): Here, the index uses specific Bitcoin-related search queries, particularly the increasing and decreasing volumes, which can be insightful for market sentiment.
The other element (15%) considered surveys. However, this feature is currently disabled.
How is the Crypto Fear & Greed Index useful?
The usefulness of this index ties back to the fundamental concept of how people are generally emotional and reactionary. Scientific research has proven time and time again how humans react with fear and greed when it comes to financial decisions.
These are potent motives that easily override any common sense and discipline. The FGI can be used in several ways. This tool can act as the first reference point that you can use to correlate with other analyses like technicals.
For example, if the index shows ‘extreme fear’ (indicating bullish opportunities), one can confidently wait for their technical analysis to present a buying signal.
Similarly, if you were already in a position and noticed the index moving towards the greed side, this could be a good time to sell. The point is you can constantly use the FGI to provide you with an overall bias on where to enter and exit the market.
Another technique, although the riskiest, is using a contrarian approach to market sentiment. The classic “Be fearful when others are greedy, and greedy when others are fearful..” quote by Warren Buffett comes to mind when thinking of this philosophy.
In other words, contrarians believe in doing the opposite where you sell when others are buying or buy when others are selling. This approach can be quite rewarding in some cases but is the riskiest and should only be practiced by the most knowledgeable.
Curtain thoughts
Using a sentiment tool like the FGI in cryptocurrencies can save you a lot of time from analyzing the data yourself. Therefore, this is an invaluable tool based on key concepts and impactful reference points.
Yet, just as with any analytical factor in the financial markets, the effectiveness of sentiment analysis can only be maximized by combining it with technical and fundamental analysis.
The former is designed to help you predict short-term price action patterns. On the other hand, the latter should help determine the long-term potential and value proposition even when there could be negative information in the interim.


Leave a Reply