There is an increasing trend where traders are relying more on automated trading than manual activities. Given the convenience that automation comes with, there is no doubt that the trend will deepen further. However, the automation of trading activities is not easy to achieve without enough knowledge about technical indicators.
Technical indicators form the backbone of any strategy that a technical trader opts to use. Simply, a technical indicator is an algorithm or a mathematical calculation that appears as a line on a price chart. Usually, traders pair the technical indicators with other instruments to come up with a winning strategy. The strategy helps traders to identify price trends, after which they make trade decisions. Ultimately, technical indicators have two primary objectives. Firstly, they identify the general trend of the market and, secondly, they pick signals with which a trader can anticipate price movements.
Indeed, technical analysis is unavoidable for traders who want to earn a decent profit. To that end, one must have access to technical analysis software that has ample forex charting tools. One example and most commonly used of the software is MetaTrader 4. With MT4, any trader with any level of experience can learn how to use technical indicators in automated forex trading. Notably, the MT4’s navigator panel displays all the technical indicators that are available for use. Alternatively, you can search on the internet for more customized and advanced indicators.

Having said that, here is a list of the best technical indicators that traders can use to automate their activities.
1. Moving Average (MA)
This indicator goes by two names that are, Simple Moving Average (SMA) or just Moving Average (MA). Indeed, this is the simplest and most popular technical indicator in the market. The moving average is one of the best forex indicators for automated trading because it is much more reliable. To be sure, technical indicators are significant when automating trades, but they are 100% reliable. Therefore, any indicator that shows higher probabilities of reliability is invaluable.
The significance of the MA indicator comes from the fact that it examines the past trends concerning a currency pair. By examining past trends, traders can successfully identify the momentum of the currency pair. Notably, the MA can be either a trend indicator or an oscillator indicator. That is why it appears under the ‘Trend’ tab and the ‘Oscillators’ tab of the MT4’s navigator panel.
MA as Trend Indicator

MA as an Oscillator

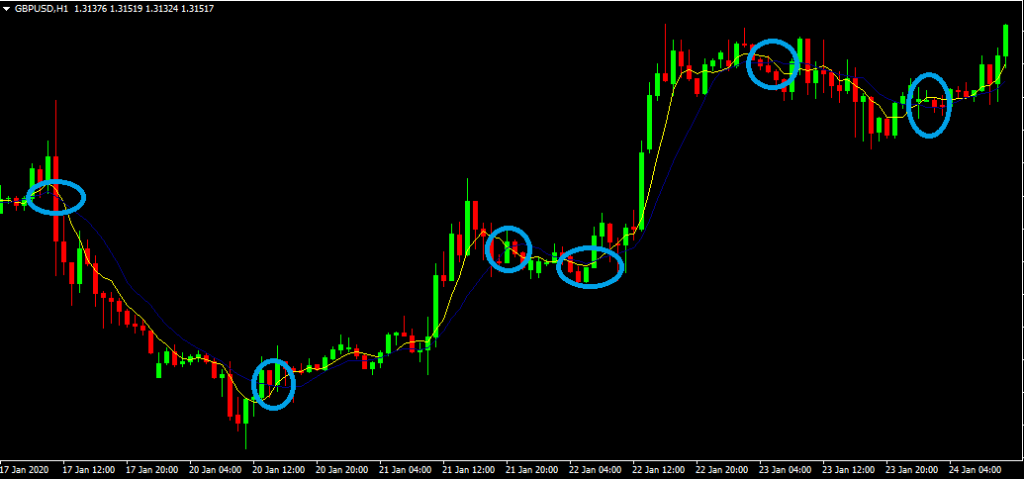
The reason why MA is popular is that it is easy to read. For example, you can quickly tell the momentum of the market when using two MA indicators, each with a different period. Say you use a 5-period MA alongside a 10-period MA. Whenever these two cross each other, it is an indication that the momentum in the market is about to change. See the chart below. (In the chart, the yellow line is a 5-period MA, and the blue line is a 10-period MA).

Due to its simplicity and ease of use, the MA is one of the best forex indicators used by expert advisors. There is a forex robot primarily centered on MA as its trading strategy.
2. Moving Average Convergence and Divergence (MACD)
Colloquially, traders call the MACD the patriarch of oscillators. It is because it takes the concept of moving averages further by enabling traders to identify biases in the behavior of a currency pair. Besides, the MACD performs the functions of the MA, like deriving signals and predicting momentum.
The MACD is particularly popular with forex expert advisors because it is best suited to predict price trends. This technical indicator appears under the ‘Oscillators’ tab of the MT4.

Notably, two chart lines make up the MACD. The first line represents the difference between the fast exponential moving average (Fast EMA) and the slow EMA. Usually, the fast EMA is 12-period while the slow EMA is 26-period. The second line represents a 9-period simple moving average (SMA).

In the image above, the red line shows the 9-period SMA. It is what traders call the signal line; that is, it indicates the likely direction of the price action of the currency pair in question. On the other hand, the histogram is the MACD oscillator, which is the difference between the slow EMA and the fast EMA. The histogram oscillates around a zero line. Notably, the zero line shows moments where the price action is mixed and could go either way.
3. Relative Strength Index (RSI)
The moving average is not enough to facilitate the best performance of the strategy of a forex EA. That is why other indicators like RSI are crucial. Notably, the RSI is a favorite of many technical traders because it increases the profitability capability of automated FX trading. Since the RSI is an oscillator, it appears under the ‘Oscillators’ tab on the MT4 platform.

Notably, traders and FX expert advisors compute the value of the RSI by comparing rate increases and rate drops of a currency pair. Usually, this oscillator fluctuates within a range of values, from zero to 100. There are bands of levels that signify different relative strengths of the currency pair.
In particular, the band from zero to 30 shows an overbought condition for the currency pair. On the other hand, the band from 70 to 100 shows an oversold condition for the currency pair. Additionally, the peak and trough divergence of the currency pair’s exchange rate enables an algorithmic FX trading system to utilize the RSI indicator better.

Notice the lines separating the oversold and overbought bands.
Bottom line
The number of technical indicators increases every time as traders continue to learn more about the forex market. Also, the increased automation of the trading activities is driving the demand for technical indicators that are more reliable. Many other indicators like Bollinger Bands, Parabolic SAR, and Ichimoku Kinko Hyo, among others, facilitate the creation of the best trading signal. Also, you might have noticed that there is a thin line between indicators and oscillators and that most of these instruments are interchangeable. Ultimately, technical indicators and oscillators help traders to predict the direction of the price action in the market.


Leave a Reply