In the Forex market, trends are everything, either you are a follower or a disrupter. So, many traders use the MACD indicator to identify direction and strength in movements. Still, what is MACD and how you can use it to make money in Forex?
Keep reading and you will discover one of the most popular indicators not only in Forex but also in the investment industry. It works for currencies, futures, Contracts for Differences, equities, futures, and even cryptocurrencies.
Ladies and gentlemen, allow me to introduce you to the MACD Forex successful marriage.
What is MACD indicator

MACD is an acronym for Moving Average Convergence Divergence. It is used to identify moving averages that are indicating new trends, no matter it is bullish or bearish. In other words, this tool shows us when a trend is starting.
It works as a momentum toll that is a trend-following indicator. The Moving Average Convergence Divergence shows the relation between two exponential moving averages that are plotted in a chart and show who is in charge, the bulls or the bears.
It is essential to understand that the lines don’t indicate moving averages of the price, but the difference between both moving averages.
MACD Calculation Formula
MACD default formula is:
MACD = 12-period EMA – 26-period EMA
The default setting for MACD is 12, 26, and 9. 12 represents the preceding 12 bars, and it calculates the faster moving average; 26 is the 26 previous bars, and it is used to calculate the slower moving average; then, 9 shows histogram, which is the latest 9 bars of the difference between the two moving averages.
The theory says that MACD triggers technical signals when one line cross above or below the other. It also shows overbought or oversold conditions with the speed of the crossover.
Finally, besides indicating a new trend, it is an indicator for the strengthening of a bias. Also, for instance, for the weakening.
How MACD works

When the MACD crosses above zero is considered bullish, while when it moves below zero, it is bearish. Also, when it bounces from below zero, it is also viewed as bullish; when it turns down from above zero, it is bearish.
Also, when the 12-period EMA is above the 26-period EMA is considered positive. On the other hand, when the 12-period EMA is below the 26-period EMA is negative. The greater the distance between the MACD and its baseline indicates that the difference between the two EMAs is bigger.
If you see the histogram, it is also a confirmation source. Traders use it to identify higher momentums in both directions.
Generally, the faster moving average will always lead the trend. It the faster is below the slower it will be considered as a bearish signal, and its separation from the zero line will represent the strength of the trend. Until it tops to an oversold condition and then everything will change with the faster MA going the opposite, or above the slower.
However, for a more accurate signal, you should only go inside the market when the faster moving average goes below or above the zero line. In the same framework, the closing signal will come when the quicker line makes another crossover in the opposite of the previous trend.
How to use MACD in Forex
So, the million dollar question, how to use MACD when trading Forex. Well, if the previous explanations or the shared charts weren’t enough, let’s make a sample case.
We are going to use an updated version of the last chart.

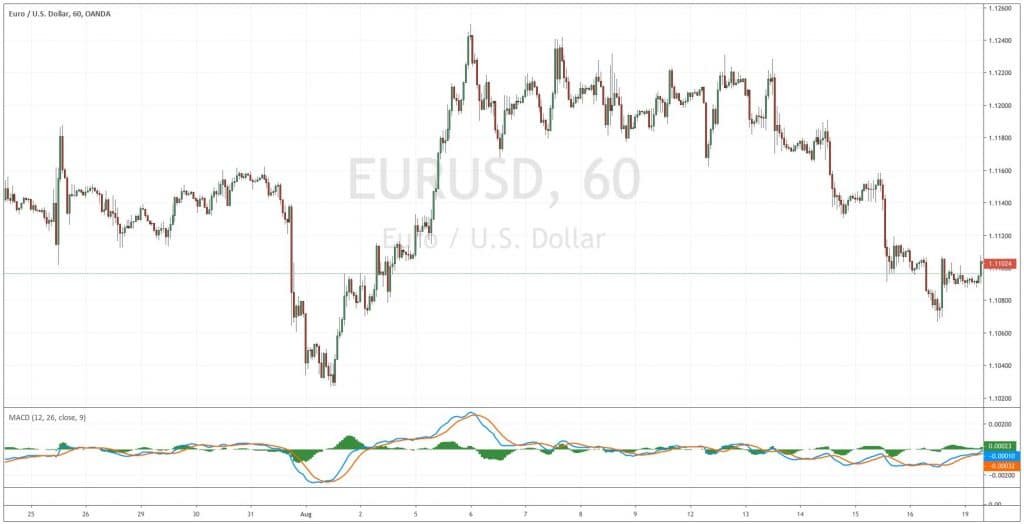
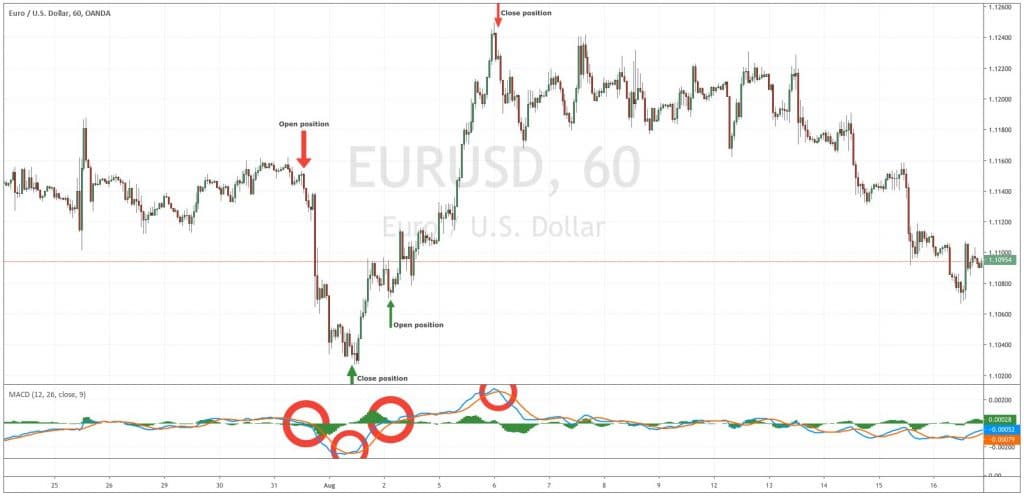
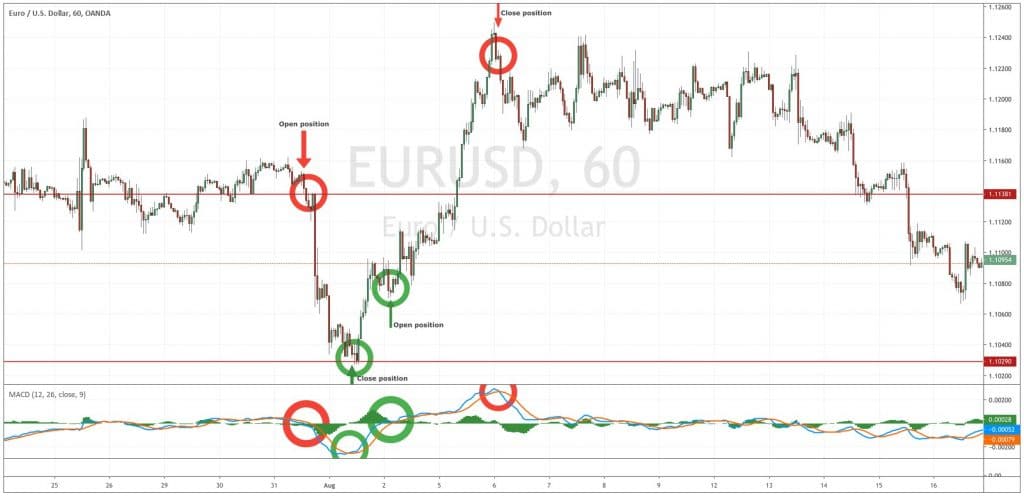
Taking the EUR/USD 1-hour chart, we have a eurodollar that was trading at around 1.1150 on July 31, at that moment, the MACD faster line (blue) was turning below the slower or red line, suggesting an upcoming downside. Then, both lines crossed below the zero line, triggering a bearish signal.
At the same time, the EUR/USD was breaking below a short term support at 1.1140, which was a level which was on play in the previous days. So, the pair broke that level, and the MACD was also giving a selling signal. A short position would be opened at around 1.1140.
Then, we let the position mature until the MACD started to show symptoms of exhaustion and then the faster line crosses above the slower line, and both lines start recovering in the direction of the zero line. It is time to close.
So, we close the position around 1.1030. We are making a profit of 110 pips from the opening price of 1.1140, to the closing value of 1.1030. In other words, a 1.0% profit in less than a day.
After that, we see that MACD is recovering and a floor was formed on the EUR/USD around 1.1030. So we wait for the critical confirmation above the zero line, which occurs at August 2 around 1.1075. Then we buy the EUR/USD at that level, and we wait.
Finally, after a long run of four days, the MACD starts to show exhaustion, and the blue line crosses below the red line again. So, our closing position signal was activated. We proceed to sell the EUR/USD around 1.1225 with a profit of around 155 pips, or 1.4%, in just four days.
Easy cake!
Voila, you just made 265 pips in two trades and in less than a week! Easy cake, right? Well, no. The market is not usually that nice. So, it would be best if you keep learning and improving your trading skills.
Always try every new skill in a demo account first, and continue reading for market behaviors and new indicators. Here in ForexTraders Guide, we have complete and easy to understand guides and materials to help you in your Forex Trading life.
Keep in touch!


Leave a Reply