
Relative Strength Index lies in the range of 0 to 100, and if the value is 30 or below, the market is said to be oversold, and the prices are likely to move upwards at this point. There are some individuals who interpret this situation as a trend reversal signal, which signifies a purchasing opportunity. If the value is 70 or more, the market is overbought, and the prices are likely to go down from this point.
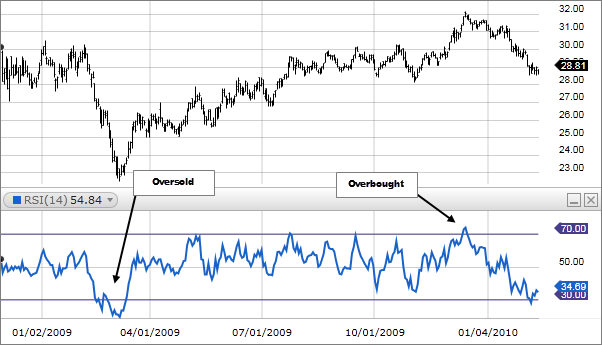
Again, some investors view this as a trend reversal signal, meaning it’s a selling occasion. Apart from indicating overbought and oversold levels, RSI also indicates centerline crossovers where an upward shift from the centerline signals a rising trend, and the converse signifies a falling trend. It is, therefore, an effective tool you can use to ride the trends and make profits.
Top 5 charts for RSI
As it is more reliable and highly advisable to combine several indicators in your technical analysis, we have selected these top five most popular and efficient combinations. The top 5 RSI charts are as follows.
- RSI + MACD
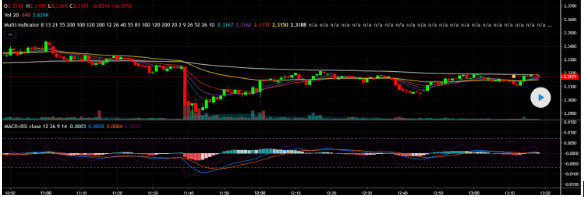
First, you need to open two charts of varying time frames but related to the same stock. For the first chart, you take the daily time frame, and for the second, the hourly time frame.
In the beginning, use the MACD indicator on the daily time frame chart without making any changes to the settings. On the hourly time frame chart, you can apply the RSI indicator, evaluating the direction in which the trend is moving.
If, while studying the histogram, you get to see that it is located above the zero level, you can state with full confidence that it is an uptrend. All signals that follow this can be used for making purchases. Conversely, if it is located below the zero level, it is a downtrend, and you need to consider selling off your asset.
- RSI + MA Cross
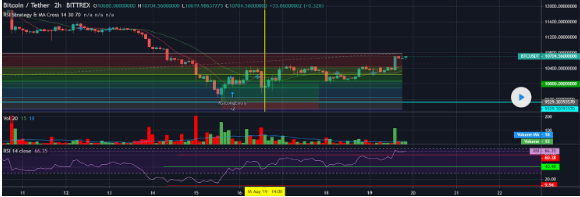
For this strategy, you require 6-day and 12-day EMAs and RSI with a period of 14 and a level of 50. This is suitable for London cross and Europe sessions, and you can use it with different currency pairs, like USD/JPY, EUR/JPY, USD/CHF, NZD/USD, AUD/USD, etc.
At the moment, the EMA 6 intersects the EMA 12, and simultaneously the RSI intersects the 50 level and moves upward; a buy signal is generated. On the other hand, when the EMAs intersect, along with the RSI moving in the downward direction after crossing the 50 level, a sell signal is generated.
This strategy is useful for day traders and those who like to ride the short-term trends. So, you should employ a stop loss at 30-50 pips and keep the risk-reward ratio at 1:1. The way you conduct your trades also decides the outcome, so you should use a demo account for some practice before using this for live trading.
After getting the buy or sell signal, instead of opening a trade immediately, you should patiently wait for the next candle to appear.
- Stochastic + RSI
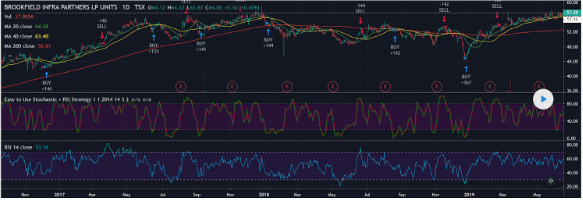
Let us assume that an asset has been displaying a downward movement for several weeks, and the RSI values are ranging around 18-60. During the latest session, you get the RSI value as 56. Now, normally, this RSI reading wouldn’t be considered valid, but Stochastic RSI tells us that it is not so.
If you calculate the Stochastic RSI for the latest session, it comes down to 0.9, which indicates an overbought signal for a downward moving asset. This means that after the bullish shift, the value of the asset is likely to fall further downward.
When the Stochastic RSI value goes below 0.5, you can enter short trades or limit your orders based on your style of trading. A good point to place the stop-loss is the bullish retrace’s peak. Since the price didn’t go beyond this point during the bullish trend, a shift above this point may indicate the death of the bearish trend.
Stochastic RSI gives out both positive and negative signals, so you need to use this with other indicators in order to confirm the trend.
- RSI + Bollinger band
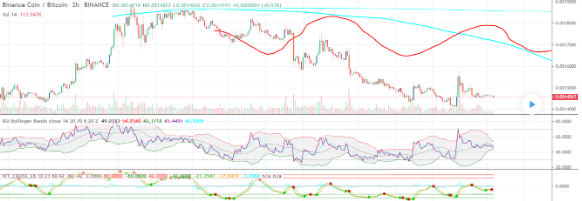
This strategy involves watching out, for instance, the RSI moves below 30, and the value reaches the lower Bollinger band (BB), generating an oversold signal and indicating a good buying entry point. A sell signal is generated when the RSI moves beyond 70, and the value reaches the upper BB.
The chart shows us that there was no price reversal when it was lying in the upper BB and the RSI was more than 70. The price keeps rising with the upper BB, with the RSI remaining above 70. In the same way, when RSI is less than 30 and the value is at the lower BB, it still doesn’t reverse.
The strategy’s reliability can be improved by establishing the rule that the signals are useless if they run into the short EMA. Additionally, the EMA (50) must have a definite direction.
- RSI + Classic Divergence
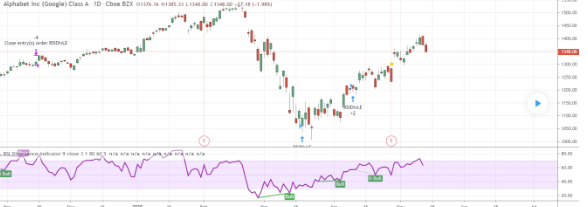
Since the RSI often shows the trend before the actual price does, trading using RSI classic divergence can give you a competitive edge. It is a low-risk strategy using which you can purchase an asset near the bottom and sell near the top.
When a bullish trend appears, you should go long, and when a bearish trend appears, and RSI exceeds 75, you should make an exit. While you are entering a signal that is overbought or oversold, you should make a purchase or sale when the price action exits the buying and selling threshold on the indicator.
A good place to set the stop-loss for this strategy is just past a swing bottom or swing top, appearing during a trend reversal.
Conclusion
The similarities between the chart situations are as follows:
- 30 and 70 are the common levels
- The signal generated by RSI can be false
- It can stay above 70 or below 30 for a long time


Leave a Reply