Defining position trading
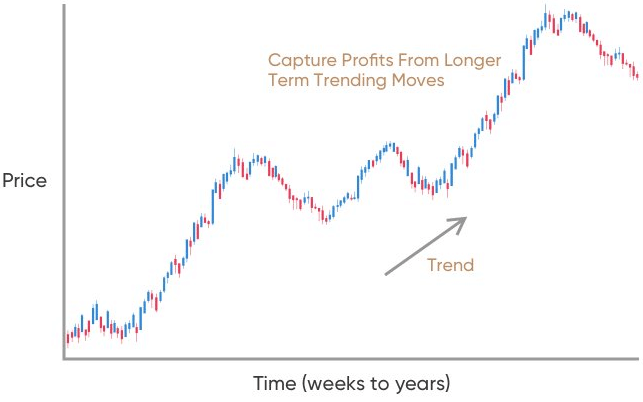
Position trading is a strategy that forex traders use to milk as much profit as possible from a long-term trend. Position traders hold a trade for extended periods of time, often months to years. This is the opposite of what day traders and scalpers do. In forex, there are two types of traders. The first type is the kind that is impatient and can hold a position for no more than a few hours. On the other hand, there are position traders who, in a sense, behave like stock traders. They believe in long positions, which are oftentimes profitable.
To be sure, position traders take the long view in all their trading activities. However, this does not imply that they do not trade bear markets. Just like any other forex trader, position traders take advantage of trends regardless of the direction. The traders use Ichimoku charts and other forex charting tools to anticipate trends. In forex trading, fundamental analysis is the ideal technique to identify trends in the market. Therefore, good position traders must develop strategies using fundamental analysis for profitability.

Secrets for finding position trades
Mastery of fundamental analysis alone is not enough for successful position trading. Similar to any other trading strategy, traders need forex trading secrets to make the most of position trading. Expert traders have defined strategies that they follow to identify trading opportunities. For any trading strategy, the most important thing is to be able to find profitable entry and exit points. Here are a few tricks you can use to find position trades.
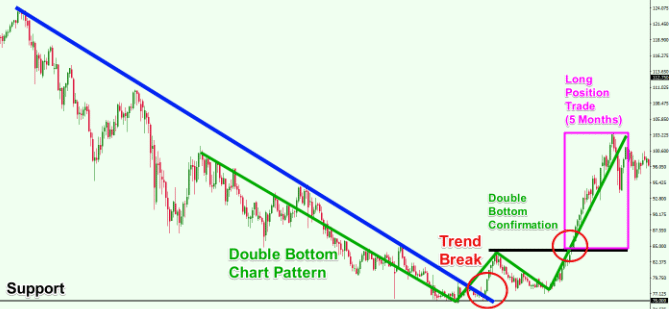
Using the trend line indicator
We already noted that fundamental analysis is ideal for profitable position trading. However, this is not to say that strategies using different technical indicators do not work. Various technical indicators are capable of identifying trends in the market. For example, an equilibrium chart will not only identify a trend but also evaluate its strength and direction.

One of the best forex indicators used to find position trades is the trend line indicator. The trend line simply shows you the general direction of the market without the short-term corrections. The ability to shut out the noise in the market enables position traders to concentrate on better price targets.
Utilizing support and resistance levels

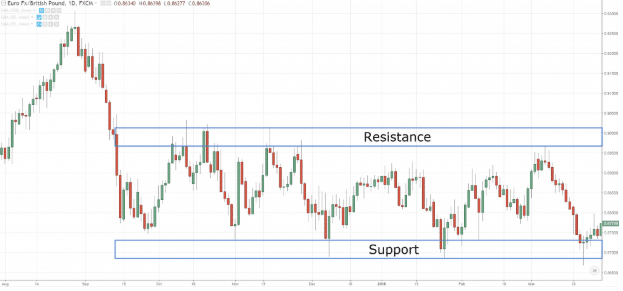
Another useful product of technical analysis are support and resistance levels. Support is the lowest price that an asset registers and one that the asset finds difficult to breach in subsequent price fluctuations. This level is like a bouncing platform through which the price cannot penetrate. Resistance, on the other hand, is the level that the price finds it difficult to breach when moving upwards. This “ceiling” tells you that the market is unwilling to bid the asset beyond the price in question.
Remember we said that position trading is all about taking advantage of long-term trends. The support and resistance levels are key points that when broken, it could be a sign of a trend developing. For example, a position trader can go long on a currency pair if the price breaks key resistance.
Use macroeconomic variables
Fundamental analysis is a crucial part for position traders. This is because the macroeconomic condition of the home economy of the currencies in question determines their future value. For example, a trader that wants to trade the EUR/USD pair might want to know the macroeconomic conditions of the US and the EU. A variable like inflation rate impacts the exchange rate of the currency.
High inflation, say in the US, means that Americans pay more to obtain essential food items. At the same time, demand for US goods from outside the country begins to diminish. Subsequently, demand for the US dollar by outsiders to pay for imported goods falls and this erodes the value of the USD. Also, this is evidence that the economy is unhealthy and it leads to the USD falling against the EUR.
Some position trading strategies you can use
Trade breakouts
Trend trading requires that you find the means to filter out the noise in the market. However, watching the noises could offer a great trading signal. Usually, short-term price movements (which we call market noise) show that the market is in a consolidation phase. These movements remain bounded with the support and resistance levels.

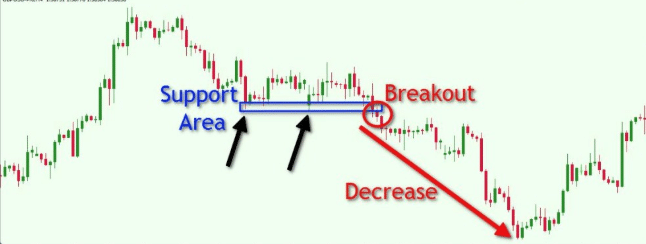
However, a major development in the market could jolt the price movement suddenly. If this happens, then the price jumps through the resistance or it falls through the support level. When you open a trade at the breakout price, you are in a better position to capitalize on the coming trend. You can easily identify breakout prices using certain chart patterns.
Range trading
The forex market is volatile and sometimes it might not show a clear trend. However, the market shifts up and down frequently. The market moves up when overbought and it moves down when oversold. Ideally, range trading works when you identify and buy oversold forex products or identify and sell overbought assets. In a way, this is similar to RSI strategies where traders focus on overbought, oversold, and divergence in the market.


Leave a Reply