Know Sure Thing, popularly known as the KST, is a momentum oscillator that Martin Pring developed in the early 1990s. Advanced traders widely use the indicator to find bullish and bearish entry levels for an asset. Let’s look at the Know Sure Thing indicator, its differences from the MACD, and how you can use it well in the market.
What is the Know Sure Thing Indicator?
The KST is a technical indicator that measures the price activity of an asset in four price cycles and then combines the results in one indicator. The tool is calculated using the same calculations that are made in the Rate of Change (ROC) indicator.
The Know Sure Thing is not provided by default in MetaTrader 4 and 5. Instead, traders interested in using the indicator must do so manually. This means that they must find it in the marketplace and then install it.
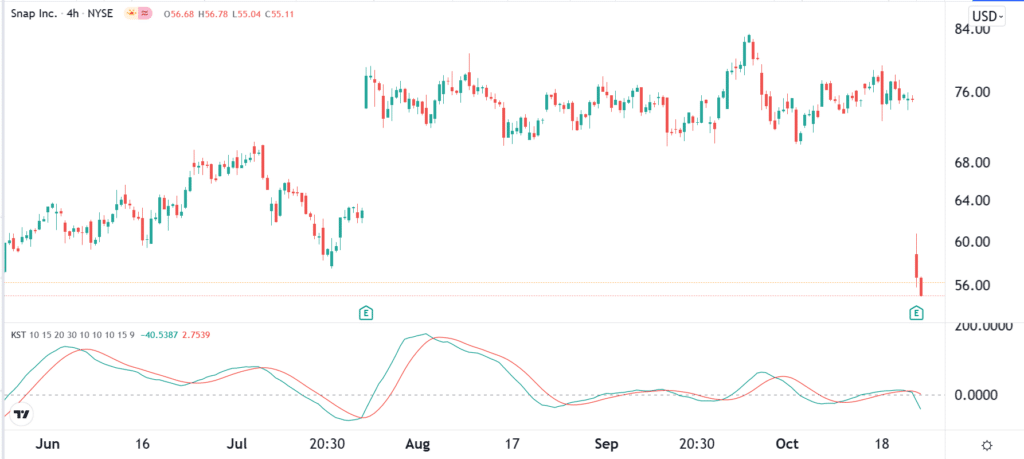
It is offered as a default indicator on TradingView. By default, the indicator has two lines that have two different colors, as you can see below.

Know Sure Thing Indicator
In this chart, the green line is the KST line, while the one shown in red is the signal line. The dotted line is known as the zero line and is one of the most-watched levels by traders.
How Know Sure Thing is Calculated
All technical indicators are calculated based on mathematical concepts. For example, the Moving Average indicator is calculated by adding the overall price of an asset and then dividing the results by the period. However, while knowing how a technical indicator is calculated is a good thing, it is not mandatory. Indeed, many experienced traders don’t know how most of the indicators they use are calculated.
The KSM indicator has a relatively complicated calculation process. For one, the trader needs to calculate four different rate-of-change (ROC) values and then smooth them.
The ROC is calculated using the following formula: (Current value / previous value – 1) X 100.
Therefore, the first step of calculating the KSM indicator is to find the first Rate of Change of the asset. You can do this by finding the 10-day Simple Moving Average of the 10-day ROC. You then repeat the same calculation four times.
Finally, you will find the Know Sure Thing indicator by doing the following:
(ROC x 1) + (ROC2 x 2) + (ROC3 x 3) + (ROC4 x 4).
The final stage of this calculation is to find the signal line. This line is found by doing the 9-day Simple Moving Average of the KST indicator.
How to use the Know Sure Thing Indicator
The KST indicator is used in a similar way to how other oscillators are calculated. It can be used to find divergences and trend following. It can also be used to validate an existing trend and find overbought and oversold levels.
Using KST in divergences trading
Divergences are a relatively popular phenomenon in the financial market. A divergence happens when a financial asset is rising while an oscillator is showing signs of fatigue and moving downwards. This is known as a bearish divergence. Bullish divergence happens when a stock or currency pair’s price is falling while the indicator is rising.
Whenever a divergence happens, it usually signs that a trend may be about to end and that a new one will begin soon.
While divergences work, in my experience, they are not the best indicators that a financial asset’s price will break out in the other direction. Therefore, you need to be careful when using them in trading.
Using KST in trend following
Trend following is a popular trading strategy that works well with the Know Sure Thing indicator. For starters, trend following refers to a trading approach where a trader buys an asset whose price has already formed a bullish trend.
Similarly, a trader can short a financial asset that has already formed a bearish trend. It differs from reversals in that the traders are not interested in timing when the price of an asset changes direction.
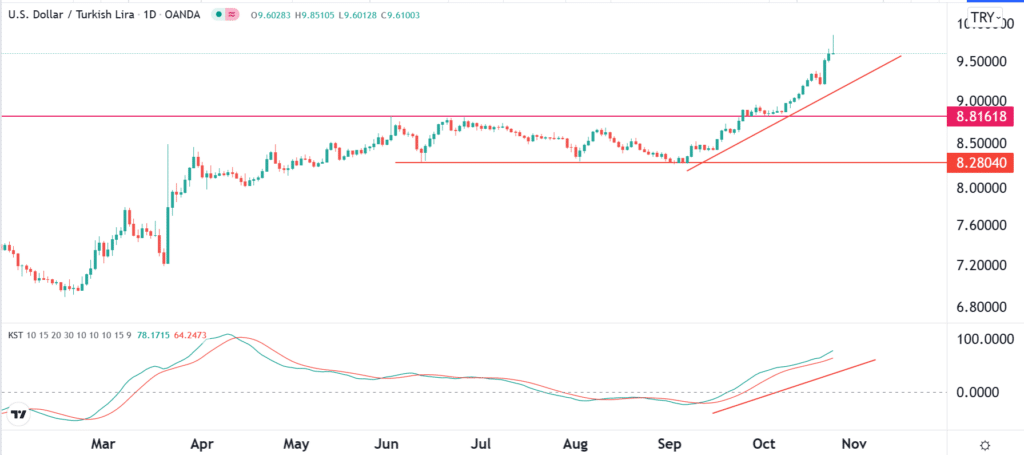
Using the KST indicator for trend-following is relatively simple. All you need to do is to identify an existing trend and enter a trade. A bullish trend will remain as long as the two lines of the indicator are rising.

Know Sure Thing in trend following
While you can use the indicator by itself, we recommend that you combine it with trend following indicators like VWAP and Moving Averages.
KST to find overbought and oversold levels
Like most oscillators, it is possible to use the Know Sure Thing indicator to find overbought and oversold levels. An oversold level is defined as a period when an asset’s price has declined sharply, meaning that buyers will start coming back. Similarly, an overbought level is when an asset’s price has risen sharply and is a sign that many buyers will start to exit their trades.

Using KST to find an overbought level
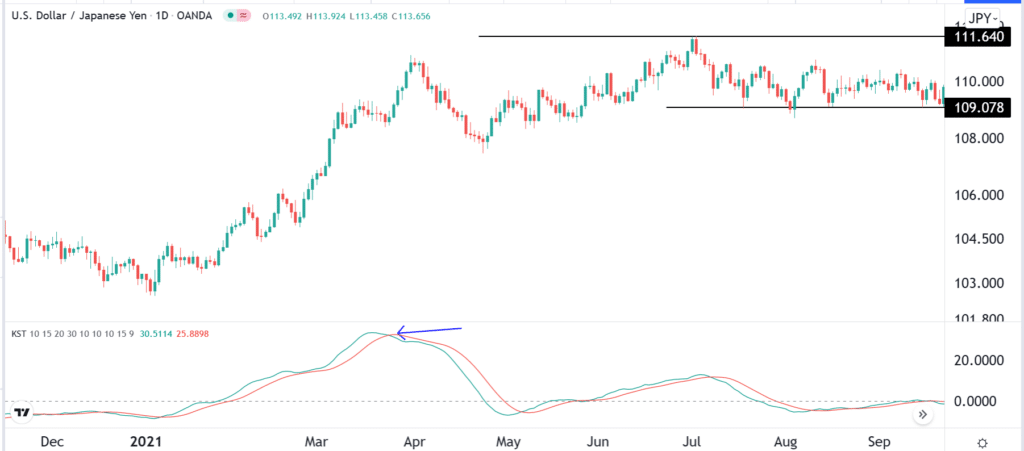
The KST indicator can identify an overbought level when the two lines have jumped sharply. In this case, a sell signal emerges when the two lines start to turn around and make a crossover. An example of this is shown in the chart above.
Know Sure Thing vs. MACD
The Know Sure Thing has a close resemblance to the MACD indicator. The MACD is made up of two lines, with one being the signal line and the other one being the MACD line. It is calculated by converting two Moving Averages into an oscillator. You first subtract the 26-day EMA from the 12-day EMA. The signal line is the 9-day MA of the MACD line.
While the two indicators are calculated using different formulas, they are both used in a similar method. The MACD is used to find divergences, in trend following, and in finding reversals.
Summary
In this article, we have looked at what the Know Sure Thing indicator is and how it is calculated. We have also looked at some of the strategies you could use to trade the indicator and the key differences it has with the MACD indicator.


Leave a Reply