The trends in sideways markets are fairly easy to spot. To detect sideways markets across a range of timeframes, you should determine the highest and lowest price levels.
These two levels establish your range. Next, in the present price range, we want to watch how the asset behaves. If it is struggling to overcome support or resistance, it signifies that the pair is trading in a range. A choppy market means we see few (if any) obvious trends moving up or down and price action consisting mostly of choppy moves with short-term bounces and spikes.
If you’re in a sideways market and trading short-term trends, then controlling your trades is key. You can’t control the market, but you can manage your trading decisions and actions, and you should implement trading strategies that avoid the pitfalls of a choppy market by adding your own control parameters.
In these markets, numerous indicators will lag, often creating worthless noise or putting you in a position too early or too late. Looking for the correct indicators without having a firm grasp on how prices move will result in making more profitable trades.
Why would a market be trading sideways?
In the event of equally strong currencies in one pair or equal weakness in the two currencies, a sideways market is a result. This causes “jumpy” up-and-down movement, as though we’re on a seesaw. Alternatively, both currencies are either doing nothing or making their own ground.
If both currencies in a pairing rise or fall simultaneously, this brings to a tug-of-war effect, which results in sideways market action. A choppy market happens when many trading pairs move in different directions at the same time. When you spot this happening, it means that the market will likely remain stalled for a while and, so, possibly moving sideways.
Prior to significant news releases, the market might get erratic and shift sideways for up to 48 hours. Multiple time frame research might help you spot a sideways market.
If the market is active in several pairs on the hourly, daily, or weekly time frames, you can assume that it is trending and will move often. When such price action begins to dissipate, a turbulent period may begin as a large number of people try to get out together. Following an overall drop in market volatility, the market begins to trade sideways on a number of equities.
How to read market trend signals
Fibonacci retracements
If a forex pair consistently swings more than 61.8 percent beyond its previous moves, it is in a choppy pattern. The goal is now greater than simply finding a correction factor (61.8%) and applying it in a single instance. You’ll have to wait for the pair to oscillate, going to 78.6% and then 100% and going back up again and again. The oscillation signals the formation of a range market.
Price trends
Price action, when used as part of your market analysis, can help you recognize choppy market conditions. If you notice an area with more than one high and more than one low forming a rectangle, the market is turbulent.
Choppy markets are easy to recognize when you employ this approach, and you don’t have to use complicated technical analysis. Using this doesn’t necessitate using indicators either.
It’s really only a two-step process of putting two horizontal lines on the chart and finding the rectangular pattern.
Choppy markets: strategies
1. Use support and resistance levels
When markets are extremely unpredictable, there are two ways to profit. Firstly, you can purchase an asset at a discount at the support price and sell them at the high price in the resistance range. Forex pairs tend to stay in a trading range when trading is choppy, making it hard to drive prices beyond key levels. If someone wants to make money with this strategy, they need to buy at support levels, then sell when the price reaches the resistance.
2. Employ oscillators
Choppy markets make profits harder to attain, but oscillating indicators can be utilized to gain an advantage.
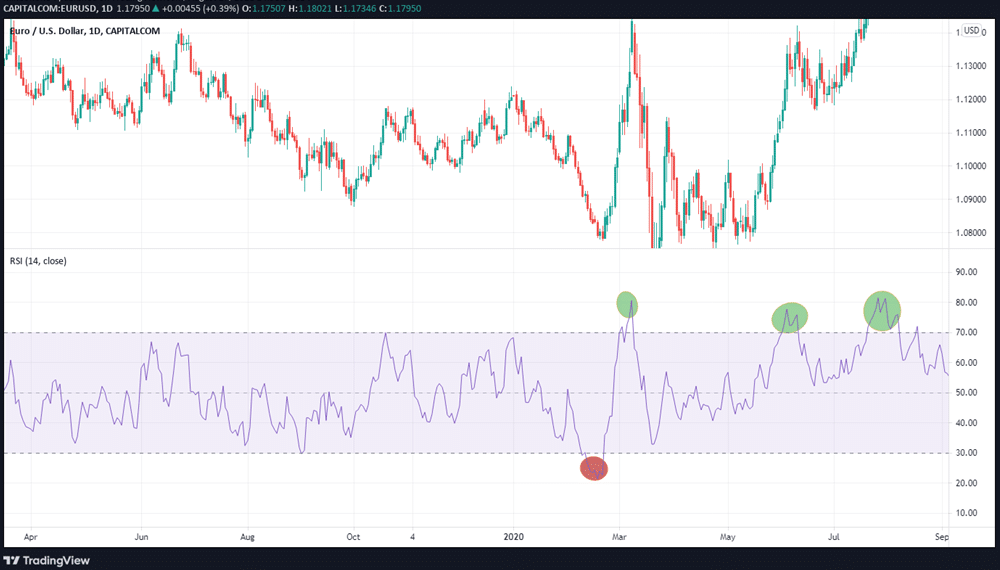
These signals are designed to use price movements to produce buy and sell signals. Traders employ oscillators such as the Relative Strength Index (RSI) when currencies are experiencing choppy trading conditions.

The chart above shows how you can find reversals using RSI. With the RSI, levels above 70 are overbought, while those below 30 denote that an asset has been oversold. This is because it might take a long time for pairs to turn around if they’re in a downward trend.
Oscillators excel in sideways markets because they can quickly go to overbought or oversold levels, making it more likely that the oscillator will achieve success.
In summary
When it comes to choppy markets, the key is to decide which asset you will trade. Once you spot an opportunity, assess the likelihood that it will stay trading sideways long enough for you to meet your profit target. Be on the lookout for breakouts and ready to close your position when the market signals that choppiness is looming.


Leave a Reply