
Sometimes, Forex traders are interested in having currency pairs that do not relate with the US dollar or the euro in their repertoire. Of course, trading the most important currencies worldwide is a good decision, but adding other pairs like the AUDNZD could increase your gains.
Did you know both the Australian dollar and the New Zealand dollar are considered risky currencies? So, it is crucial to trade this pair more carefully due to its movements. However, this will allow you to develop strategies that are uncorrelated with the rest of the market, as the economies of the world’s major markets will have little effect on this pair.
Regarding Gross Domestic Product (GDP), Australia currently ranks in the top 15 of the world’s largest economies. In contrast, New Zealand ranks near the top 50. The fact that Australia is among the top 15 countries makes investors worldwide looking for opportunities in the Australian dollar.
This article will teach you all the fundamental and technical aspects you need to know to include this pair in your trading portfolio successfully.
Fundamental aspects
Taking into account the news and economic indicators when trading Forex is essential. So, to trade this pair, we have highlighted some of the most important fundamentals that we will talk about below.
Export of commodities
Australia is a significant exporter of metals such as gold, iron ore, coal, and copper. On the other hand, New Zealand depends on exporting milk, meat, and wool.
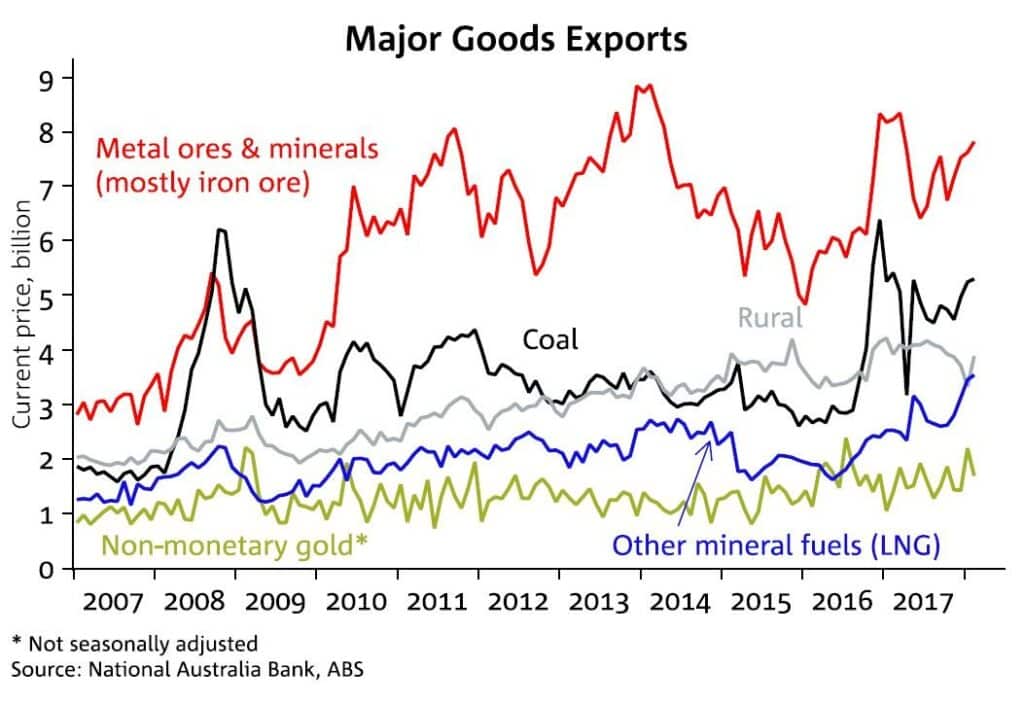
Checking commodity prices on a country-by-country basis is key to finding correlations in the AUDNZD currency pair.
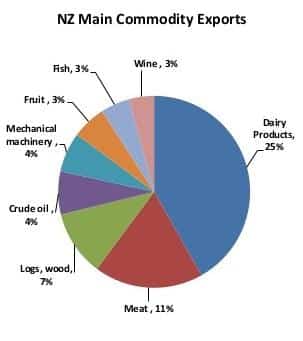
It is also essential to check the data related to the increase or decrease of exports provided by the Reserve Bank of Australia (RBA) and the Reserve Bank of New Zealand (RBNZ).
Weather patterns and tourism
Keep in mind that the performance of the AUDNZD is usually sensitive to weather patterns and New Zealand’s tourism sector outlook. So, if either country suffers a severe weather event, it will affect the price of the pair.
One of the big problems in Oceania countries is wildfires; high temperatures and prolonged droughts in Australia cause fires that can destroy thousands of hectares of land.
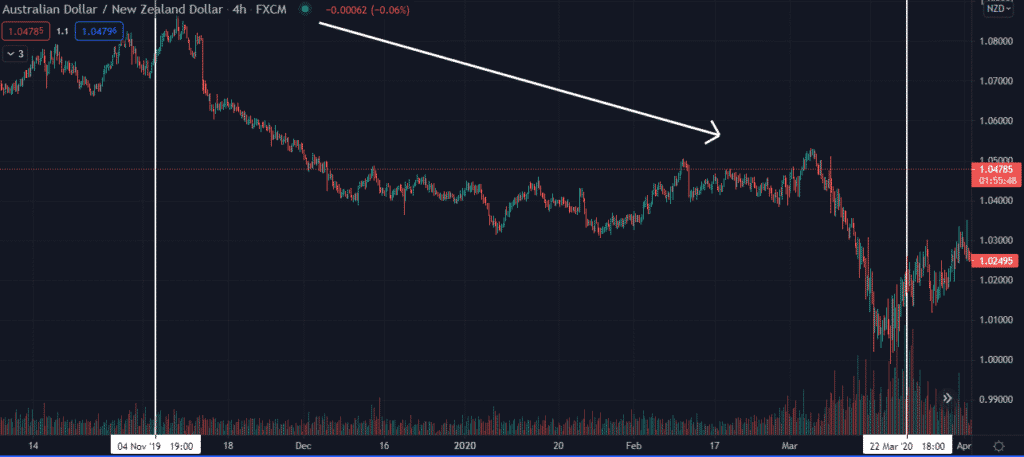
So, for example, let’s look at the chart of AUDUSD above. You will notice that between late 2019 and early 2020, the price falls during the bushfires in Australia.
Asian influence on the AUDNZD
Both Australia and New Zealand have close commodity export relationships with China, India, and Japan.
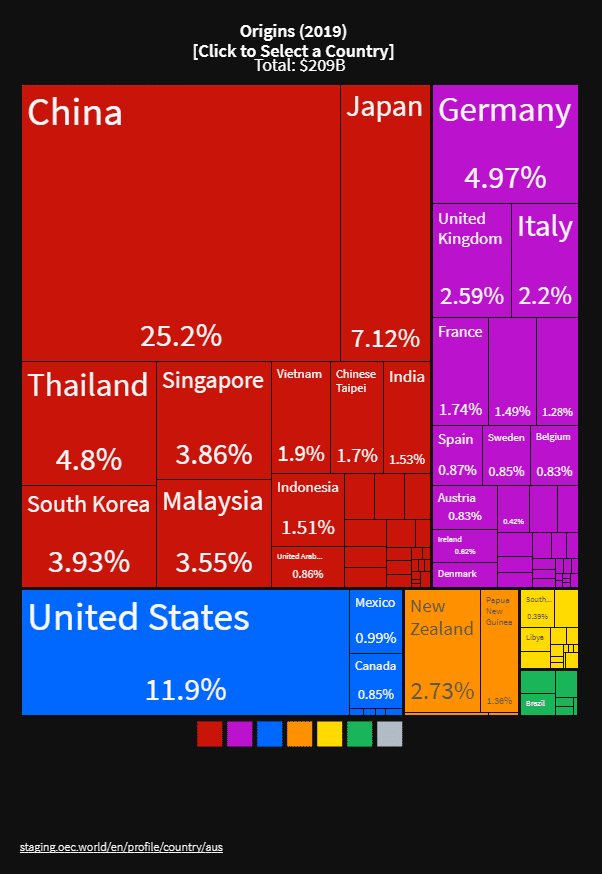
Therefore, the constant supply and demand for these commodities will positively or negatively affect this pair.
Monetary policies
The economic outlook influences the price of AUDNZD, so it is vital to pay attention to this data. For example, a decision by the Bank of Australia on interest rates or the release of important economic data can cause volatility in the currency pair.
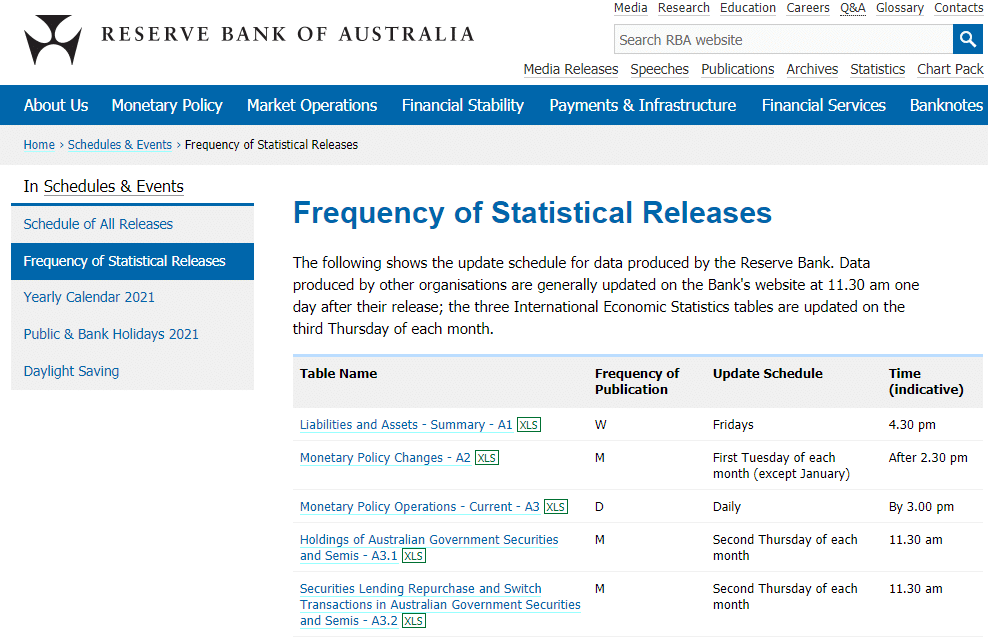
So, following the financial news will allow you to stay one step ahead to predict the direction of the price.
Technical aspects
Usually, the AUDNZD is not affected by news or events outside the borders of these two countries, which allows us to perform technical analysis with ease. Therefore, we should only be concerned with economic data from Australia and New Zealand and not the rest of the world.
What’s the best time to trade AUDNZD
High volume can be found at the opening of the Sydney market; this happens at 20:00 UTC and the beginning of the Tokyo Stock Exchange at 00:00 UTC. The high liquidity can last throughout the early morning of these sessions; these are the ideal times to trade good movements, especially for scalping or intraday.
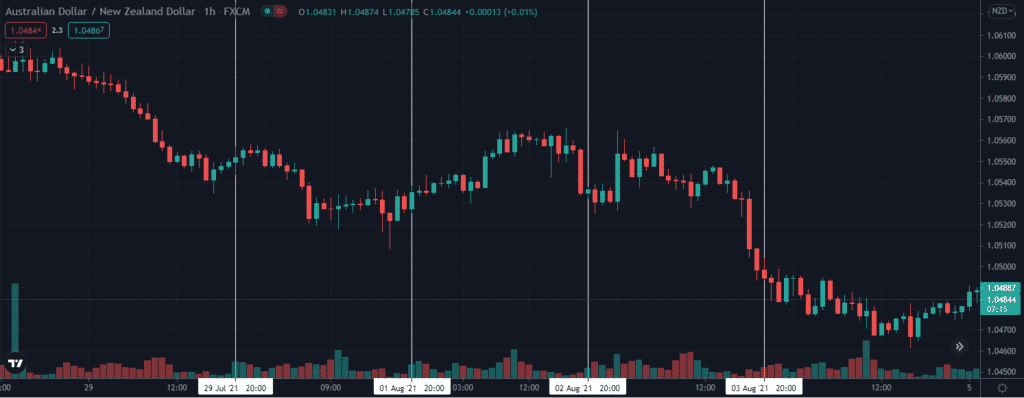
In the chart above, you can see the times when the pair is traded the most actively (marked with the white vertical lines).
Best indicators and strategies to trade the AUDNZD
One of the disadvantages of trading AUDNZD is that the spreads and liquidity are not the best compared to pairs such as EURUSD or USDJPY. Knowing that you can create a specific strategy for this pair.
Volume indicators are the main ones to consider. The Money Flow Index (MFI), the Accumulation/Distribution, or the VWAP may work. You can also include the Relative Strength Index (RSI) and Moving Averages to identify trends better.
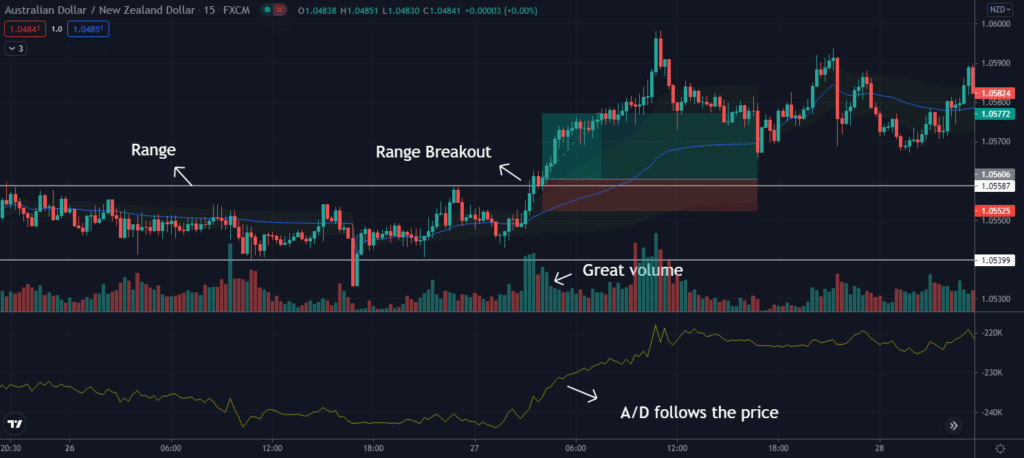
In the following chart, we will see an example using volume, Accumulation / Distribution, and VWAP (blue line). The price stays in a range for hours, and after breaking the range, we see a significant spike in volume followed by the A/D.
Thus, the perfect entry point would be right after the breakout. With the combination of these indicators, you will be able to recognize range breakouts and short-term trends. For this strategy, you must use intraday time frames.
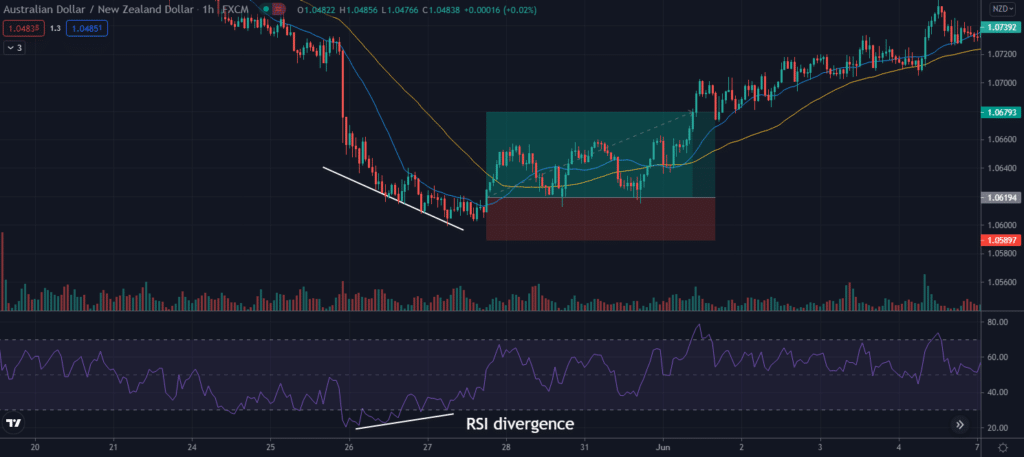
Using the RSI as a strength indicator will help you identify price divergences. Look at the overbought or oversold levels and at the new lows and new highs that the asset makes to identify that disparity with the indicator.
Once you identify the divergence, it is time to take a position. In this case, as it’s a bullish divergence, we should buy.
Follow the trend using Moving Averages such as 20, 50, or 200 periods. You can use one of these or combine them according to your taste and needs. For example, if you expect a significant price movement, use the 200 periods. On the other hand, if you hope for small moves, use the 20 or 50 periods.
Conclusion
Considering that European and US markets are the most influential globally, traders will look for currency pairs to diversify. They would prefer to add to their investment portfolio a currency pair that has little or nothing to do with these markets.
Trading AUDNZD has certain advantages and disadvantages. One of the advantages is that it has low volatility compared to other currency pairs. The low volatility is beneficial for swing traders. However, the disadvantage for scalpers is that the spreads do not favor them.
Based on all the information presented in this article, the ideal way to trade this pair is to consider the fundamental and technical aspects to increase profitability.


Leave a Reply