The Golden Cross
Technical analysis is an important tool used to predict future price movements of stocks. A Moving Average (MA) defines the average price of an asset over a given period of time. In technical analysis, the Golden Cross is a pattern where the short-term MA crosses the long-term MA from below. Conventionally, in a Golden Cross, the 50-day short-term average is considered to cut the 200-day long-term average from below. However, there isn’t a strict rule regarding the time frame. Any time period with substantial difference can be considered for a golden cross (or even death cross) – as long as the short-term trend shows strength against the long-term trend. After the short-term average cuts the long-term average, it moves upward rapidly and stays above the long-term MA. As a trader, you should keep a track of the occurrence of a golden cross since the high trading volume and trading prices suggest a strong recovery and signals a bullish trend. However, investment related decisions should not be taken by considering the golden cross in isolation as it is a part of a much larger and volatile system.
The Death Cross
In direct contrast with the Golden Cross, the Death cross is a pattern where the 50-day short-term MA cuts the 200-day long-term MA from above. The short-term average then moves downward rapidly representing a downtrend and the development of a long-term bear market. Traders keep close track of the death cross since this pattern suggests an unfavourable time for investments in the market due to probable fall in the values of the assets. In the past, the death cross has shown bearish signals just before major economic slowdowns, such as those of 1929, 1938 and the recession of 2008. However, relying solely on death cross is not advisable as the market may also gear up and resume an uptrend soon enough.
Examples and Setups
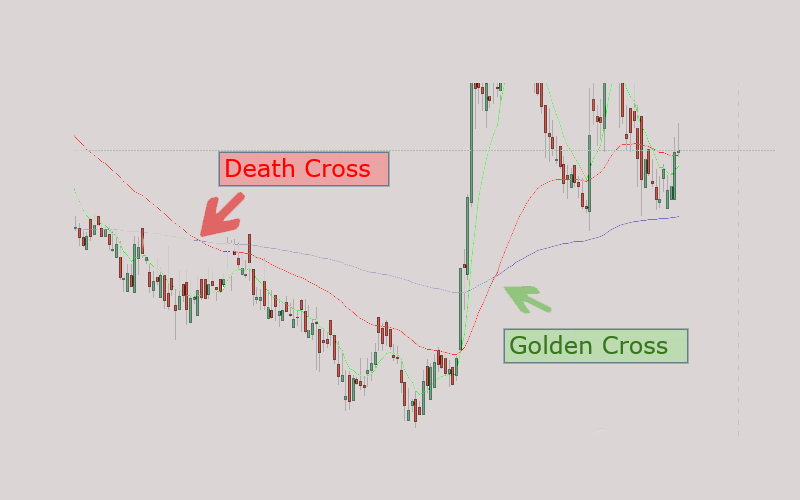
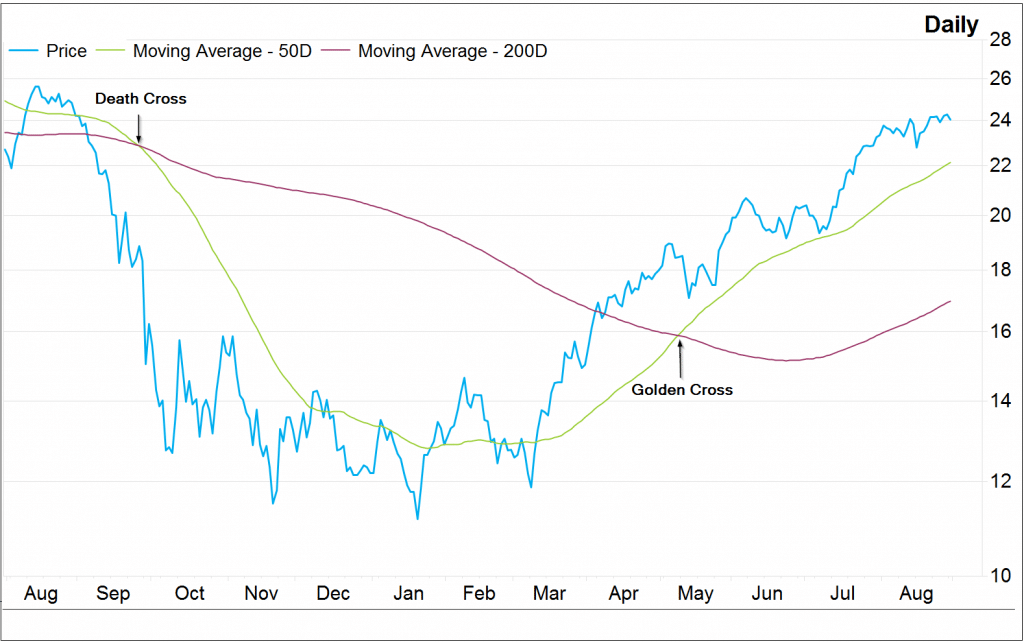
Death cross and golden cross are opposing concepts. Here is some easy-to-follow illustration, so you can distinguish them from each other:
Experts argue that neither crossovers are absolute indicators of a prolonged bullish/bearish period. It is quite possible that the market may very well change trends after the occurrence of either the golden or the death cross. Moreover, the market is dynamic and no downtrend or uptrend lasts forever. Please note that the concept of crossover is based on moving averages, which are essentially lagging indicators – i.e. they lack predictive power and merely indicate a reversal in a trend that has already occurred.
In such a scenario, a smart strategy would be to use the crossovers as a trend filter.
When a golden cross occurs, the market is expected to remain in the bullish trend for a while. If you think that you can sell when the 50 MA crosses from below and make a ton of money, you may actually get whipsawed! Instead, you should use the crossover as a bias to look for proper set-ups – whenever the 50-day crosses over the 200-day MA, use the golden cross as a positive bias and look for long setups and buy opportunities only. Once a death cross occurs, you can expect the market to be in for a correction or maybe worse, a recession. Just as you used the golden cross, likewise, you can use the death cross as a trend filter to keep you in defensive and use it as a bias to look for short set-ups. Therefore, once a death cross has occurred, look for selling signals.
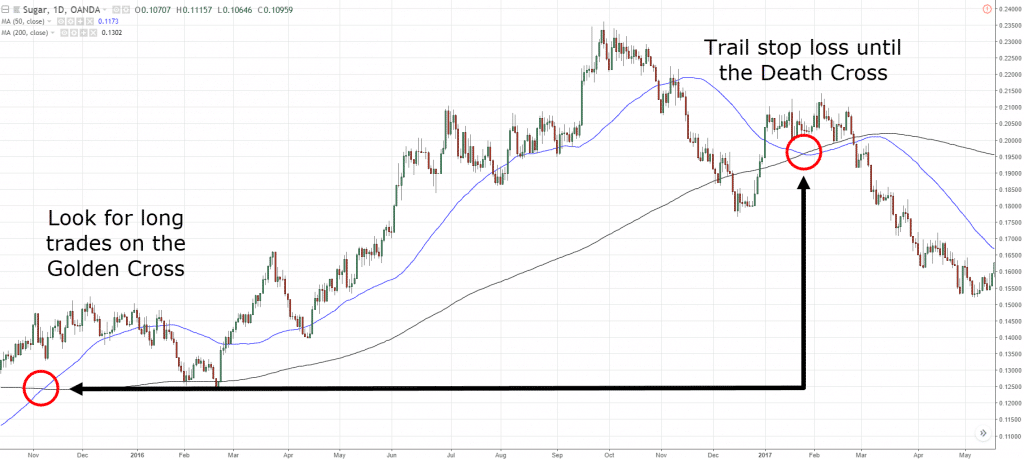
However, it is advisable to not go long immediately after the occurrence of a golden cross as the market may be overextended and show high prices. It will be prudent to treat the crossover as a signal to look for long trading options. Similarly, in the case of a death cross, you should wait it out and look for patterns that suggest short trading options. This way, you can use the crossovers to better time your entry. You can make use of the multiple time-frame analysis to analyze the forward time frame to look for a valid trading setup and decide whether to trade at all. You can also easily ride massive trends by holding your position until the 50-day MA crosses below the 200-day MA (refer to the diagram below). The crossovers can, therefore, be efficiently used to time your entry, have tighter stop losses and a favorable risk-reward ratio.
Conclusion
Proper technical and statistical analysis is crucial to make informed predictions about the current and future market conditions to ensure profitable trades. Among the many patterns available at your disposal, the Golden Cross and the Death Cross are two commonly used setups. While both patterns occur when the short-term MA crosses a major long-term MA, the golden cross depicts an upcoming bullish market, whereas the death cross depicts a long-term bearish market scenario. The crossovers signal a change in market trends and can be used to strategize trades. You can also use the golden cross to ride great trends as well. However, it is prudent to use the crossover as a trend filter and not an absolute indicator of a trend. It is advised to refrain from blindly trading after the crossovers as the market can easily whipsaw you.


Leave a Reply