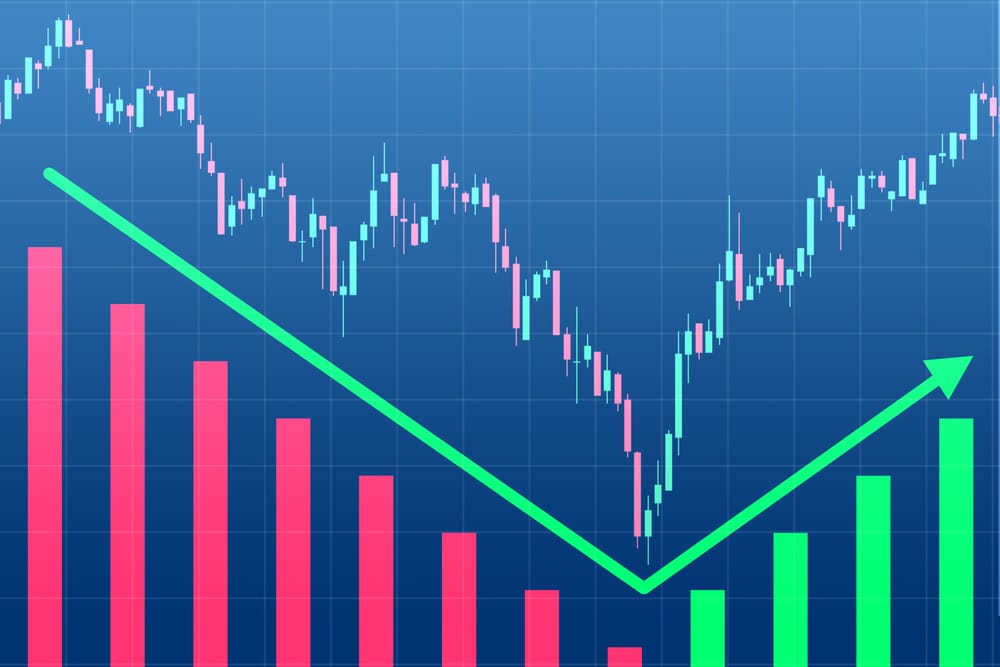
A dead cat bounce is a phenomenon used to describe a period when a stock, currency pair, cryptocurrency, and other assets experience a brief rally during a sell-off. It is also known as a sucker or relief rally and is one of the most dangerous situations in the financial market. This article will look at what a dead cat bounce is, how it forms, and how you can trade it.
What is a dead cat bounce?
A dead cat bounce is a relatively popular scenario in all types of assets. In most cases, it happens after a major market event like earnings or an economic data release. In other situations, it happens when a market rally is fading or when a reversal is about to happen.
When it happens, the asset’s price stages a recovery for a few hours, days, or even months. Since the overall trend is bearish, the price then breaks out lower and continues the downward trend.
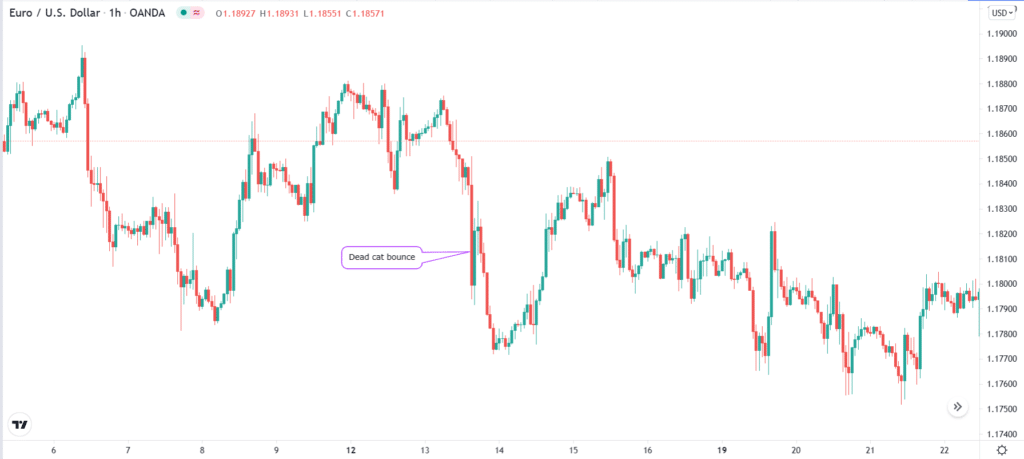
The chart below shows an example of a dead cat bounce in forex. As you can see, the pair is in a bearish trend. As it drops, the pair then bounces back for a while. This gain is short-lived, and the price resumes a downward trend.

How a dead cat bounce forms
To understand how a dead cat bounce (DCB) forms, you should first know how asset prices move. In most cases, there are usually reasons why asset prices move up and down. The underlying reason is demand and supply. A stock rises because there is strong demand for the shares.
This demand is caused by expectations of growth for the stock or dividend growth. For example, shares of growth companies like Square and Okta rise because investors expect that the firm will one day become highly profitable. On the other hand, shares of firms like AT&T and BP rise because of their strong dividends.
In forex, pairs rise because of several factors like expectations that a central bank will hike interest rates and favourable economic data. Some of the most important economic numbers in forex are non-farm payrolls (NFP), manufacturing and services, inflation, and retail sales.
Commodities mostly rise because of expectations of high demand and tight supplies. For example, lumber prices surged between March 2020 and May 2021 as investors priced in higher demand because of substantially low interest rates.
Therefore, at times, investors can start pricing in a change of tone in the market and push prices lower. For example, they can start pricing in tightening by the central bank and slow economic growth. This, in turn, can push the asset price substantially lower. For stocks, other things like management changes, weak corporate earnings, and a new competitor could also push the price substantially lower.
As the price drops, it will likely attract some buyers seeking to buy the dip. However, after a few days or weeks of gains, the price will resume the downward trend.

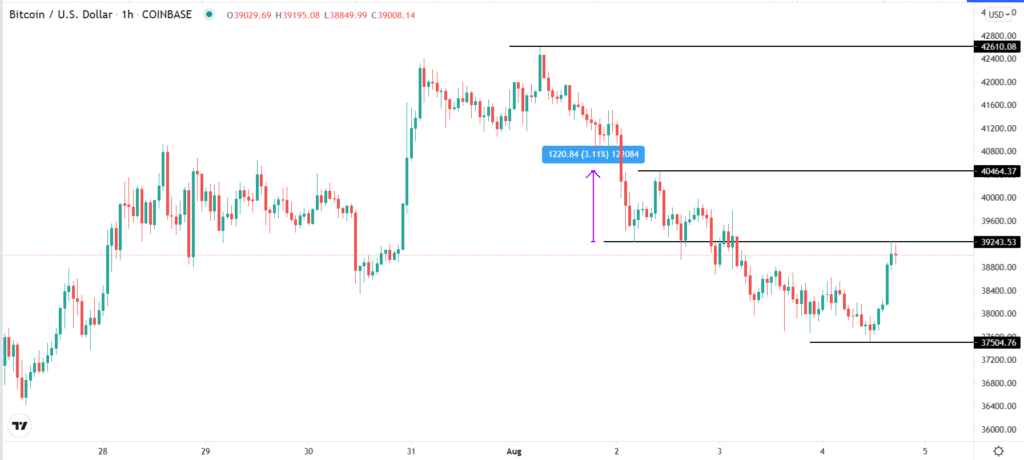
A good example of a dead cat bounce happened in August 2021 in the crypto market. As shown above, Bitcoin rose to a high of $42,610 on August 1. It then started a downward trend and moved to $39,243. After this, the price rose by more than 3% and rose to $40,465. Finally, the coin’s price retreated to $37,500.
How to trade dead cat bounces
A dead cat bounce is a relatively difficult thing considering that it is only validated after the fact. Still, there are some approaches to avoid being caught in a dead cat bounce.
First, avoid buying the dip before a proper bullish pattern is formed. While buying the dip can be a profitable idea, it can also be a risky one if it turns out to be a DCB. Therefore, we recommend that you wait before you buy a stock or currency pair that has just dipped substantially lower.
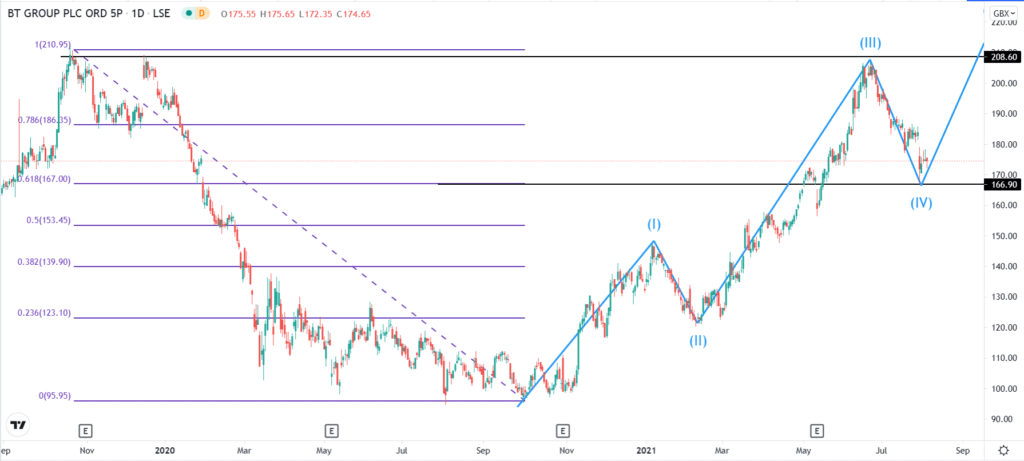
Second, you should establish whether the decline is part of a trading pattern. There are several patterns that professional traders use. One of the most common ones is known as the Elliot wave. The wave pattern suggests that financial assets move in five waves. The first one is bullish and is followed by a short reversal. This one is then followed by the longest part of the wave and another pullback. The final part is usually bullish.
The chart below shows the Elliot wave pattern at work. The stock reached a high of 208.60p and then declined to 166p. Before that, you see that the stock completed waves 1,2, and 3.
Notably, the lower point is along with the 61.8% Fibonacci retracement level. Therefore, if there is a bounce at this level, there is a high probability that it is not a dead cat bounce. Alternatively, you can wait and see whether the asset will move below the 61.8% retracement level.

Third, at times, you should look at whether the bounce is part of a break and retest pattern. This is a pattern where a stock price or currency pair retests a key level and then continues the downward trend. They are common in patterns like triangles, double-top, and head and shoulders patterns.
At times when the price breaks below a key support level, it tends to move and retest it and then resume the downward trend. Therefore, you should first clarify whether the jump is part of such a pattern.
Summary
A dead cat bounce is a popular situation that typically happens when forex pairs and stocks are at the end of a major bull run. Some traders rush to buy the asset hoping that it will resume the bullish trend. This article has looked at how a dead cat bounce forms and some of the top strategies to use.


Leave a Reply