
Stocks, currency, and commodity prices don’t behave randomly or chaotically. Instead, they follow specific patterns that repeatedly occur, which experienced traders leverage to squeeze substantial profits in various marketplaces. The Elliott Wave is a perfect pattern analysis theory commonly used in technical analysis.
The strategy is based on people’s psychology while trading various financial instruments. Developed by Ralph Nelson Elliott, the strategy is based on the theory that mass psychology always reoccurs in waves regardless of the instrument under study.
In its simplest form, the strategy assumes that prices in the financial market move in waves. Likewise, it becomes pretty easy to make price predictions based on various wave patterns that occur as price oscillates up and down.
The five main wave structures
According to the Elliott Wave strategy, there are usually five waves in patterns that come about as price oscillates up and down. One of the waves manifests itself as an impulse wave. The wave moves in the direction of the long-term or primary trend and occurs in five patterns.
Likewise, there is a correction wave that occurs in the opposite direction of the long-term trend. The corrective wave usually has three patterns.
Similarly, the theory consists of five waves that move in the direction of the underlying long-term trend and three waves that move in the opposite direction. For the Elliott Wave theory to be complete, the 5-3 pattern must remain constant.
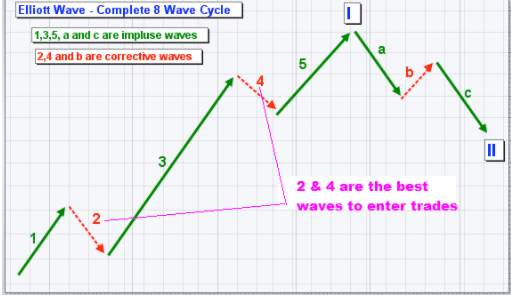
Consider the chart below.
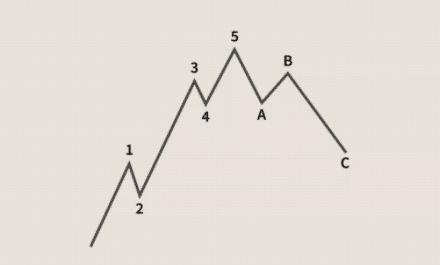
As it can be seen, there are five Waves 1, 2, 3, 4, 5 in the long uptrend, conversely forming the impulse wave. In the chart above, Waves 2 and 4 are not aligned with the trend, while Waves 1, 3, and 5 align with the primary direction, which is upward.
Upon price peaking, at point 5, it hit a strong resistance, reversed direction, and started edging lower. The corrective wave comes with three distinctive price movements and often ends way above where the long-term trend began. It is also clear that Waves A and C are in the opposite direction of the main trend, while Wave B is in the direction of the main trend.
Conversely, the Elliott Wave theory is made up of an impulse or motive wave, which signifies price is moving in the direction of the long-term trend, and the corrective wave, which signifies price has corrected and is moving in the opposite direction.
The wave pattern structure
Consider the chart below.
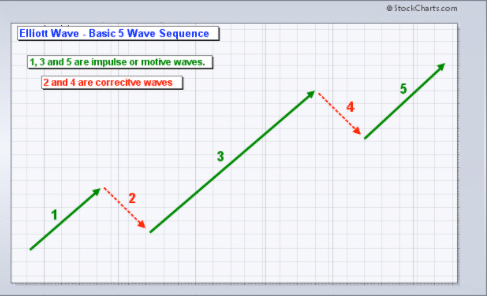
In this case, the impulse waves are 1, 3, and 5. The impulse or the motive waves always move in the direction of the primary trend. While the corrective waves 2 and 4 are always moving in the opposite direction of the primary trend.
Rules of engagement
For the theory to stand, the following must be true.
Wave 2 should never correct more than 100%. In this case, it should never correct such that it collapses close to where Wave 1 starts.
Wave 3 should always be the longest of the three motives or impose waves. In this case, the price should move much higher or longer in Wave 3 for the theory to hold.
Wave 4 can never overlap Wave 1. What this means is that the lowest point of Wave 4 can never go below the high of Wave 1.
How to use the Elliott Wave theory
Consider the chart below of a EUR/USD currency pair. Price appears to have bottomed out and moved up in what appears to be a new uptrend. Label this new move high as Wave 1, as it is the motive wave.
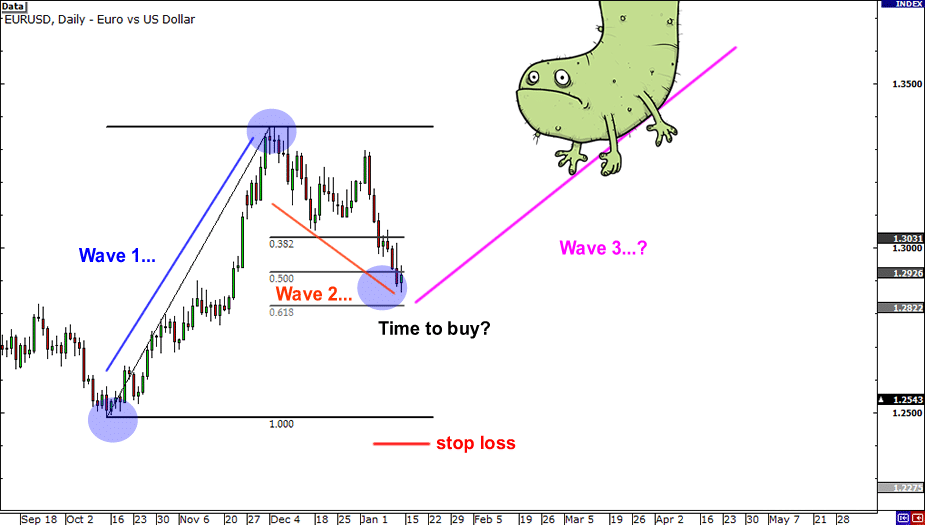
Once the price peaked, it hit a strong resistance level and started correcting lower. Price moving lower resulted in the corrective wave. Considering rule two, Wave 2 can never correct 100% or move close to where Wave 1 started if the correction theory is to hold.
Using a Fibonacci retracement tool, it becomes clear that the price is struggling to go past the 61% retracement level signaling the end of the corrective phase. The fact that Wave 2 can never go beyond Wave 1 presents an ideal entry point.
The end of Wave 2 would be an ideal point to enter a long position with a stop loss placed where Wave 1 starts as indicated above.
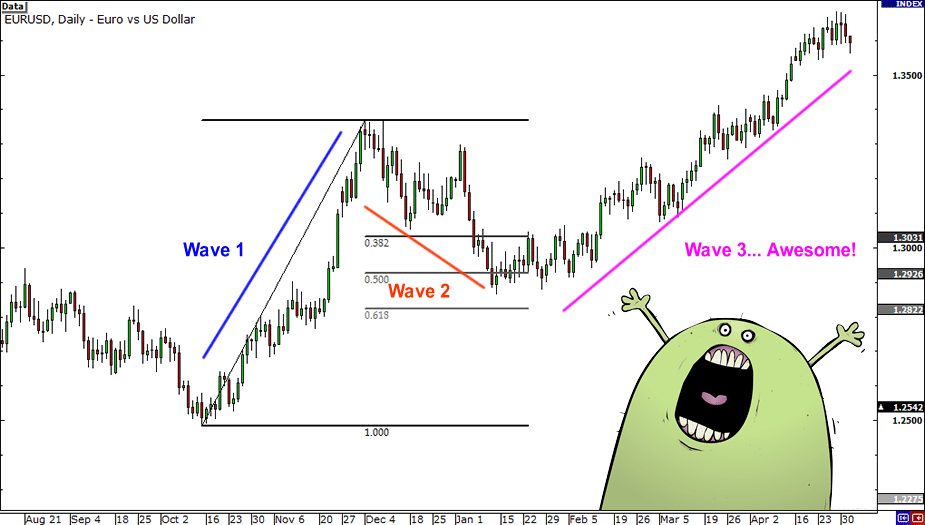
The chart below shows that the correction phase comes to and ends close to the 61.8% level, resulting in a massive Wave 3, much longer than Wave 1.
Example 2
Consider the EUR/USD chart below, whereby price appears to be trending lower going by the massive Wave 1. After a while, the price corrects and moves higher, resulting in Wave 2, which is much smaller than Wave 1 and does not correct 100%.
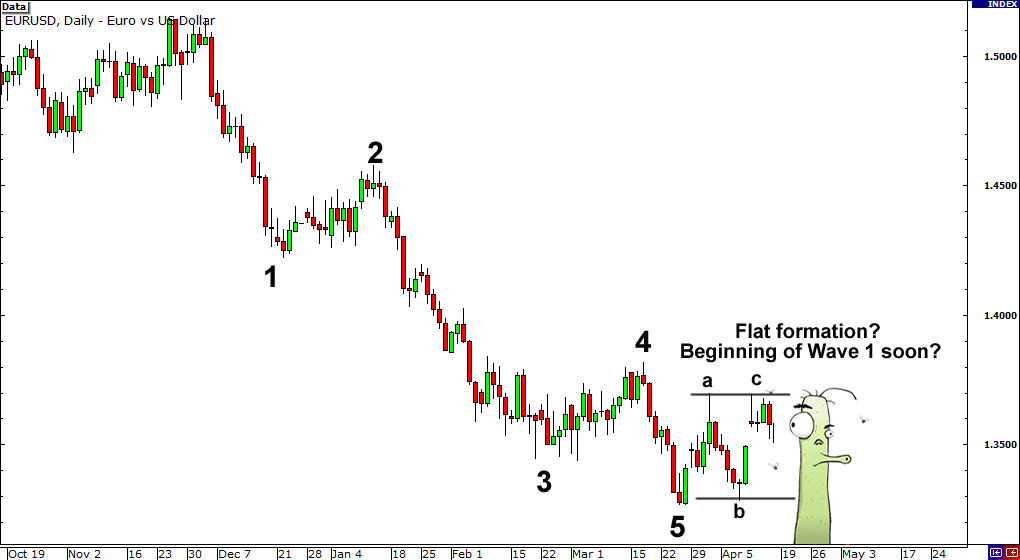
Once the correction phase is over, the price corrects and moves lower aggressively, with Wave 3 being much higher than Wave 1.
What to remember why using Wave Elliot Theory
It is important to note that the strategy is used to target the end of Wave 5. While in most cases, Wave 5 is usually smaller than Wave 3, at times, it could be much longer.
In case of an uptrend, you can apply the length of Wave 1 to the low of Wave 4 to get an idea of where Wave 5 is likely to end, and this would be an ideal target of a position opened where Wave 4 ends.
The best places to enter trade while leveraging this strategy are at corrective Waves 2 and 4. The correction, in most cases, attracts more traders as prices tend to rally aggressively from these levels. The profit target will, in most cases, be the length of Wave 1 or Wave 3.
Bottom line
The Elliott Wave Theory is an important market analysis strategy for traders who cherish technical analysis. The strategy works best for traders who like to open and close trades based on price patterns or how price moves up and down amid phases of rallying and correction.


Leave a Reply