When it comes to talking about Forex trading, the type of chart that you use plays a vital role in your investment history. Either you are a short-term trader, or scalper or even a lone wolf who left his or her positions mature enough, the type of forex chart will help you in your career.
Today, we will talk about candlestick charts and how it will make your trading life more comfortable and, at the same time, you will understand why candlestick is the more popular chart in the industry.
What is a candlestick chart
A candlestick chart is a visual tool to follow price fluctuations in a variety of markets. It is the most popular type of chart in the Forex market due to its easy way to be used.
With candlesticks, you won’t need calculation skills to understand what prices are doing. Candlesticks are simply visual aid which shows price movements.
Candlesticks were originated in Japan back in the 18th century when a rice merchant from Sakata, Munehisa Homma, identified patterns in the rice price in the Osaka Ojima rice market.
However, candlestick charts only started to be widely used after 1850, and then in 1900 Charles Dow initiated the United States into the world of the candle sticks. It became, later, famous amid its variety of possible Japanese candlestick charting techniques.
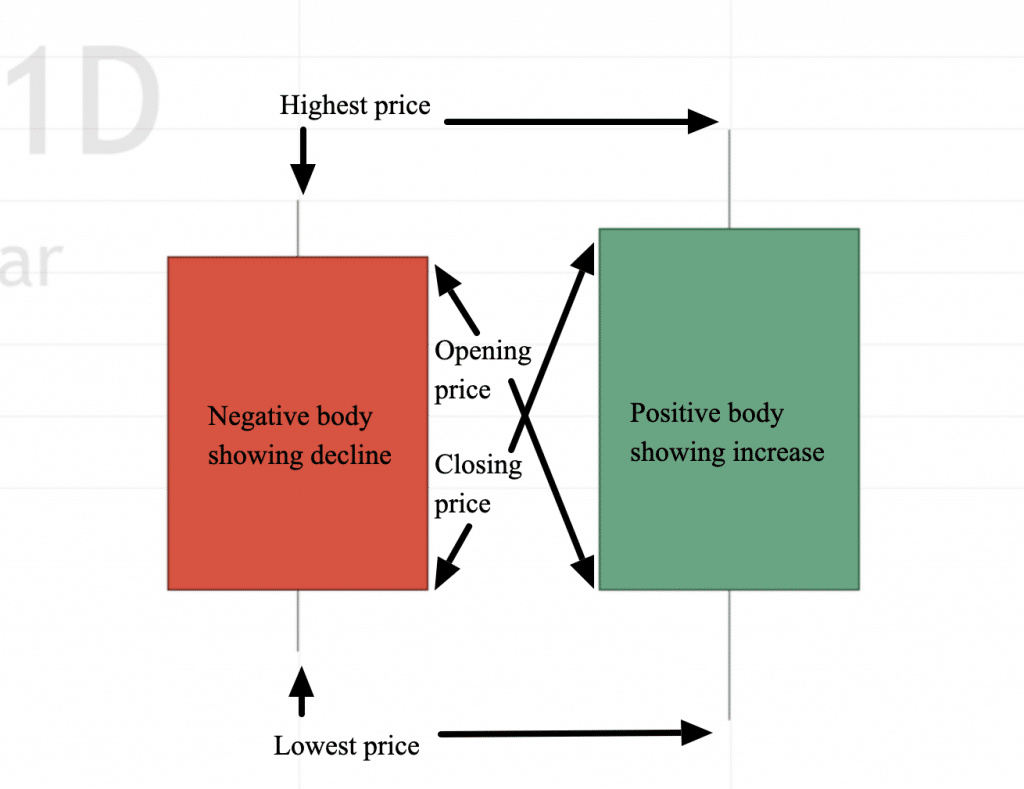
Each candle stick reveals five pieces of information that are essential for traders: The opening, closing, high, and the low prices, and the direction of the unit. It works the same for every timeframe in the platform.
Always opening, closing, high and low, but more visual than other types of charts so traders can easily understand where the candle is heading.
How to read candlestick charts
As shown before, positive and negative candles provide useful information for traders, the lines above and below the body tell us the highest and the lowest prices.
Also, the beginning of the body shows us the opening and closing prices, but the magic occurs here. In negative candlesticks, the seller, opening prices are always above the closing price, and then the color of the body is red, or sometimes black.
In positive candles, or buyers, the opening price is always below the closing price. Candles are usually green or white when positive.
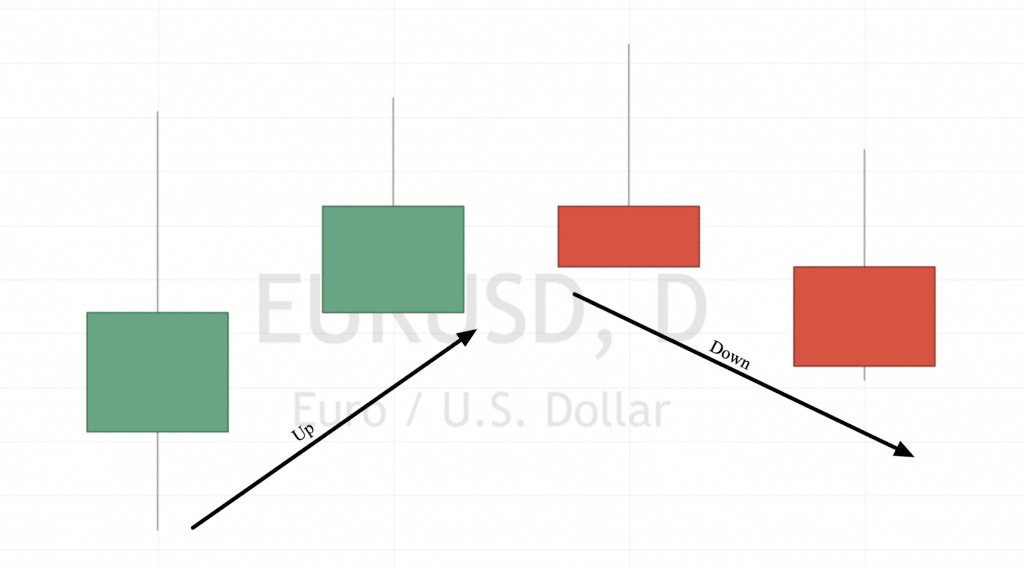
How to read candlestick chart information? If after a negative candle, the next one is also a seller to make a decline extension, it signs that sellers are in control of the market, so they are willing to keep selling.
On the other hand, If after a positive candlestick, the next one is also a buyer, it shows that bulls are in charge and they are willing to continue buying, and the price will go up consistently.
Now you’re ready to learn some basic candlestick patterns and how to use them.


Leave a Reply