
Regardless of which financial asset you’re trading, it is always wise to open positions in line with a major, sustained trend. To that end, there are several trend-following indicators that have been invented to date. However, most of these will only point out the direction of market movements and hardly do they ever gauge the strength behind such moves. The ADX, however, has a momentum component that helps traders avoid entering positions on trends that are on their last legs.
Defining the ADX
First introduced by legendary trader Welles Wilder in the late 70s, this is a tool that is used to gauge the direction as well as momentum behind a particular market movement. It is based on Moving Averages, which means it utilizes averages of past price values to gauge whether the market is declining, range-bound, or an uptrend. It consists of three lines, a positive directional index (+ DI), a negative DI, and the main ADX line. All of these lines are displayed on a chart in a separate window. This chart is scaled vertically from 0 to 100.
How it is calculated
Let’s look at the elements of the tool in the formula below.
In the formula above:
+DM is the difference between the current high and the previous high, while -DM is obtained by subtracting the current low from the previous one. The ATR refers to the Average True Range, while N is the number of periods used in the calculation. Most charting platforms use a default 14 periods, but you are free to adjust this figure as you see fit.
Computing the above calculation will yield the three lines of our indicator. The positive directional index is often displayed as a green line, while its negative counterpart is displayed in red. The ADX will typically be black or blue in color on most platforms. The latter is the line that utilizes the 0-100 vertical scale. Once again, all of these colors can be adjusted at will.
Interpreting the ADX
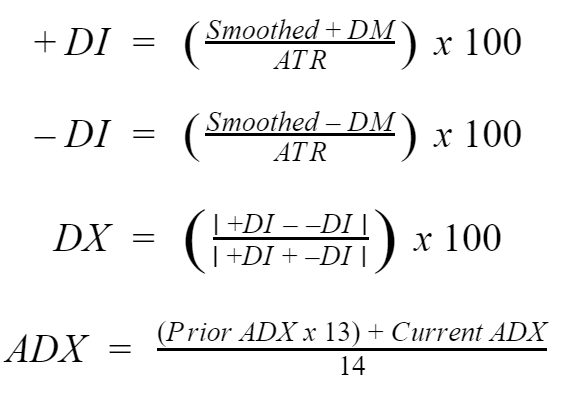
The figure below shows our indicator as applied on a 4-hour Bitcoin chart. There are different ways of reading this tool. First, recall that we established the ADX line is usually blue or black. When this line is trending up, the market can be assumed to be in a strong trend. When it takes a downward trajectory, it means the prevailing trend is losing momentum.
Usually, the 0-100 vertical scale has a threshold at the 20 or 25 level. An ADX reading below this threshold shows an extremely weak trend, which means the market is in consolidation. A reading between 25-50 indicates a fairly strong market trend. ADX trending in the 50-75 zone would indicate the market is in a very strong trend. Anything above that, though rare, would be an extremity, and it could indicate overbought or oversold regions.
Additionally, when the green +DI line is above the negative, the bulls have the upper hand. Conversely, if the -DI is trending above its positive counterpart, then the bears are prevailing over the bulls.
Types of ADX signals
DI crosses
Whenever the +DI crosses above the -DI, this typically points to a bullish reversal in the market. To gauge whether this incoming trend is sustainable, we check the ADX reading at the time of the crossover. If this reading is above 25, the incoming bullish trend is likely to persist. In the same way, a cross of -DI above the positive would point to a bearish reversal, especially if the ADX reads above 25 at the time of the cross.
Identifying consolidations
Whenever the ADX reading falls below 25 and remains there for some time, it shows the market is range-bound. In such conditions, prices will adhere to support and resistance levels more strictly, which in itself presents trading opportunities.
Breakout signals
After a period of consolidation, prices may stage a breakout in either direction. However, it is not uncommon for these breakouts to turn out to be false. To avoid being misled by trading a fake-out, check the ADX reading whenever the price breaks past support or resistance. If this reading is above 25, the breakout can be thought of as sustainable and traded appropriately.
Sample ADX trading strategies
Since the ADX is based on MAs, it is largely a lagging indicator. For that reason, it is not always effective as a standalone indicator. It is best used in conjunction with complementary indicators such as the RSI and MACD.
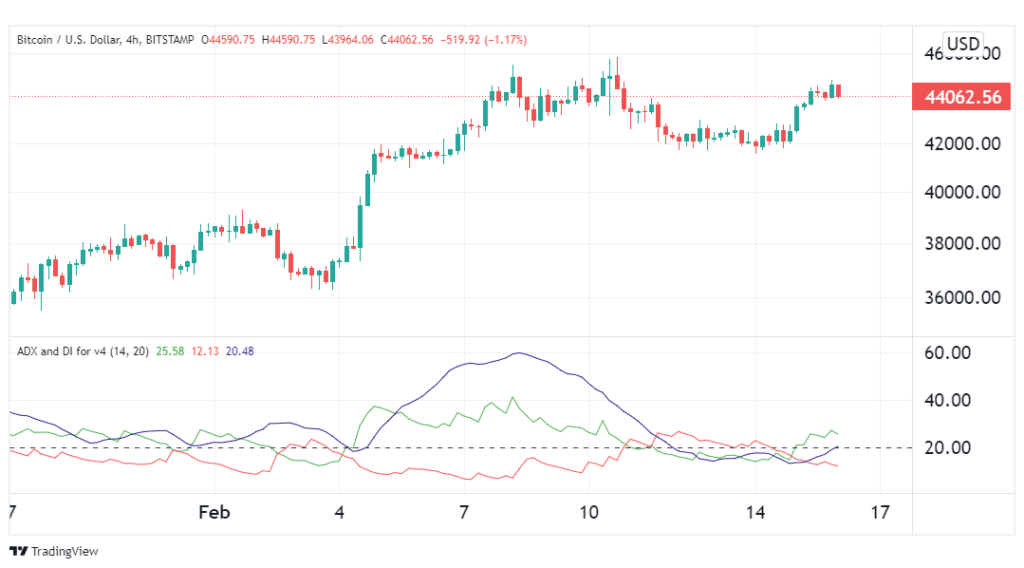
ADX + RSI strategy
This strategy is best suited when the market is in consolidation. In the illustration above, the EURUSD pair was range-bound.
On 7th December, its prior decline was weakening as evidenced by the ADX reading below 25. When the RSI went oversold, it gave the buy signal as it showed the end of the decline. On 16th December, the prior rally was weakening as the ADX read below 25. An overbought signal from the RSI confirmed the sell signal as prices approached resistance.
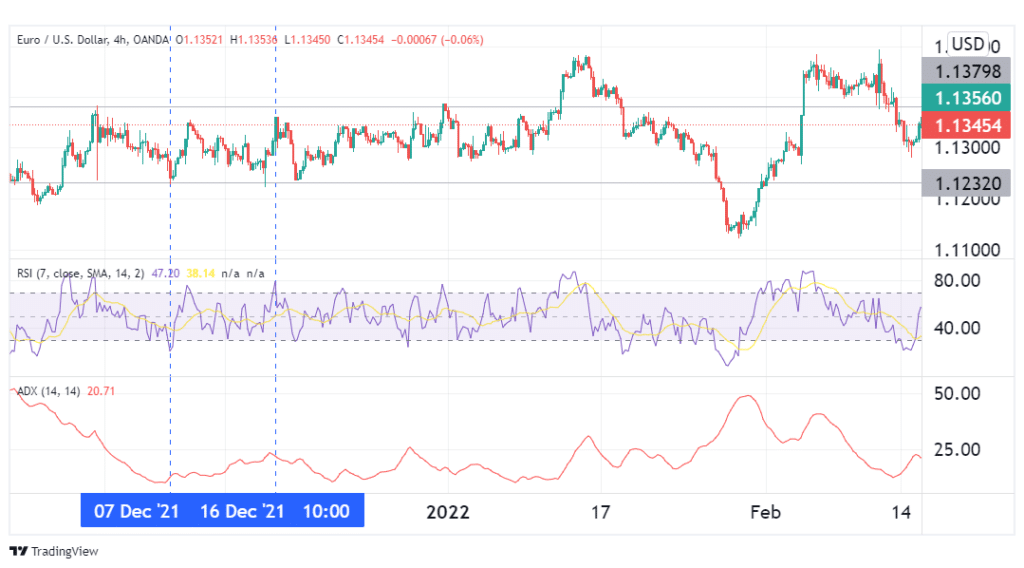
ADX + MACD strategy
This indicator combination is best suited for trading markets in strong trends. From the ETHUSD chart above, we see a cross of +DI above the -DI line on 26th April. At the same time, the ADX reading was slightly above 25, and the MACD confirmed this signal by going positive. This was the signal to buy ETH.
Come 12th May, the red -DI line crossed above the green +DI, indicating a bearish reversal. Soon after, the MACD went negative and the ADX line crossed above its threshold. This was the signal to close our long positions on ETH.
Conclusion
The ADX is a tool used for measuring trend momentum as well as identifying its direction. This is achieved using three lines namely the ADX, the +Di, and -DI. Since it is a lagging indicator, it is best used in conjunction with other complementary tools such as the RSI and MACD.


Leave a Reply