Traders use the DMI for assessing the direction of price trends. It is an essential tool to assess the direction of the price and the strength of the movement. Traders using trend strategies will find this indicator very useful.
This is because it emphasizes the trend’s weakness or strength so the trader enters a trade during a real momentum. Another advantage of DMI is any time frame is permissible and it is applicable to any vehicle, including futures, currencies, mutual funds, stocks, etc.
The index comprises of two lines, one for a positive directional movement denoted as +DI and the other for negative directional movement denoted as -DI. DX, denoting directional movement is an optional line. It signals the variation in the two lines -DI and +DI.
Calculation
+DM denotes the price of the former high subtracted from the existing high and -DM denotes the prevailing low deducted from the former low.
TR denotes true range, which is indicative of larger values of existing low deducted from the existing high, preceding close deducted from the existing high, and existing low deducted from the preceding close.
The TR, -DM, and +DM values are found for every specific period. Generally, there are 14 periods. The amounts are gathered and smoothed using a system created by Wilder.

The negative or positive directional indexes are computed as TR percentage using the formula below:
+DI = (+DM / TR) * 100
-DI = (-DM / TR) * 100
How to Interpret
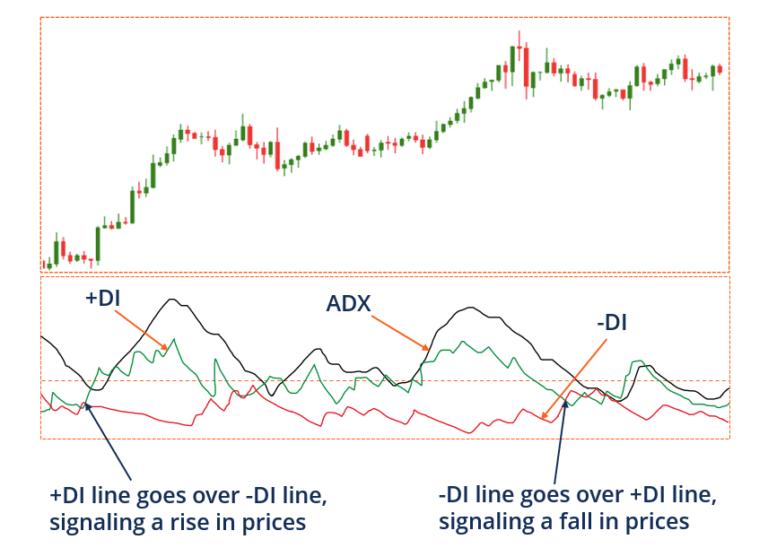
This technical indicator is generally found above or below a price chart. The calculation is done using the current and previous range of prices. When +DI is present above -DI, it denotes a higher upward pressure and less of downward price movement. If -DI is placed above, there is downward price momentum.
Traders use crossovers between the two lines as signals for selling or buying. In case the two lines are crossing each other backward and forward, there is not much of a price trend; instead, there is a sideways price movement.
The DMI is also used to find the ADX (Average Directional Index), which denotes trend strength. Downward or upward movement strength is assessed using DMI and the resulting line of trend strength is called ADX.
Traders apply this indicator to gauge how strong a particular trend is. Values of 25 or more specify a tougher trend and a lower reading indicates the trend is weak and moving towards the side. When used with DMI, traders can confirm or filter the signals.
Using DMI
The gauge for buying is when +DMI moves above -DMI and the sell signal is when the -DMI moves above +DMI. Wilder recommends the exploitation of the extreme point filter to avoid whipsaws. The long position should not be activated unless the value has moved over the high registered on a specific day when the +DMI moved above -DMI.
For trading short, you need to wait for the bar low to be taken out when -DMI moved over +DMI. One important factor to remember here is that it can apply only during the occurrence of price trending. Using ADX as an adjunct will help to know about the occurrence of market trending.
Conclusion
While ADX, +DI, and -DI can be derived in a single window, it is also possible to use each of them separately. You can opt for ADX alone for the analysis to finding out the trend strength mainly.
In other cases, you may opt for DMI for evaluating the price movement. One big advantage of using DMI is it enables you to identify the selling as well as the buying pressure simultaneously so you can determine which is dominant before you enter. DMI also helps in spotting volatility in the price. In short, the index helps you identify the right strategy while trading.

Leave a Reply