The Average Directional Movement Index, also known as ADX is an unusual trend indicator to measure trends. Having roots back in 1978, the ADX was first applied at a time when currency markets didn’t exist as it does today. Back then, only the stock market speculators had the interest to trade with ADX. In the past currency markets, institutional players dominated the trading making it difficult for retail traders who had to pay substantial operational costs.
The Average Directional Movement Index has some unique qualities. As a trend indicator, it does not appear on the main chart when used in a trading platform such as MetaTrader 4. Unlike the different Bollinger Bands or moving averages, the ADX appears in a separate window at the bottom of the main chart.
Explaining and Interpreting the ADX indicator
The ADX indicator as it appears today on trading platforms is actually a combination of two previously developed indicators, the +DI and –DI indicators. They show either a positive or negative directional bias. The information provided by them is combined by the ADX, adding a smoothed moving average in an attempt to smooth out the result.
Before trading with the ADX, traders should know that +DI represents a positive directional indicator while the –DI represents a negative directional indicator. It is to be remembered that the ADX only shows the market movement’s strength and not any future market direction.
Applying ADX on a chart in MetaTrader 4
MetaTrader 4 is arguably the most popularly used trading platform on a global scale. It provides the ADX as a trend indicator. After selecting ADX on the platform, traders can choose the main settings such as selecting the style line, the period, and how to apply the indicator when compared with real prices. The default period is usually 14, as is the case with many other indicators such as RSI. It is generally considered that the ADX provides flatter information as the period used is increased. Thus, considering more periods while using ADX becomes a problem.
The two-directional indicators, namely the +DI and –DI, are usually shown in red and blue respectively. Traders are requested to change the line format to “continuous” to make them a bit thicker, before using ADX. This is done for increased visibility for the trader.
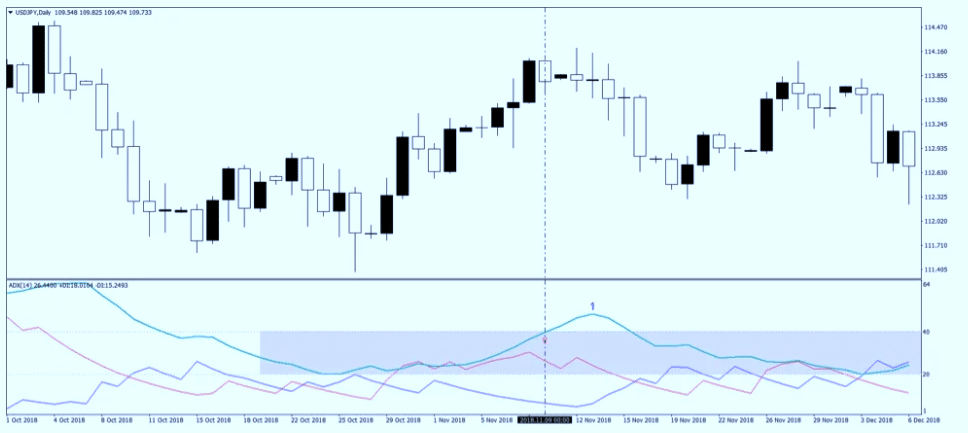
To explain further, we take the USD/JPY daily timeframe as an example.

In the above chart, the red line represents the +DI, the blue line represents the –DI, and the green line represents the ADX.
How to Interpret the ADX Indicator
A trader is required to interpret all the three above lines in order to trade with the ADX. It is a positive indicator, producing values between the range of 0 to 100. The three major things to focus on here are the +DI and –DI cross, as well as the slope of the ADX. A bullish cross is formed when the red +DI crosses above the blue –DI. Similarly, a bearish cross is formed when the +DI or red line falls below the –DI or blue line.
If any of the above situations occur, it indicates that it is time to trade with the ADX. Traders should keep in mind that two major situations might emerge while interpreting the ADX.
- The ADX is above the 40 level
- The ADX is below the 20 level
Trading with ADX Above 40
The first step before a trader needs to take is to alter the ADX window, adding the 40 levels to it. This can be done by making a right-click anywhere on the Meta Trader 4 chart. They should then select the Averaged Directional Movement Index from the indicators list tab and click on the edit button. Under the Levels tab, they can click add and insert the 40 marks.
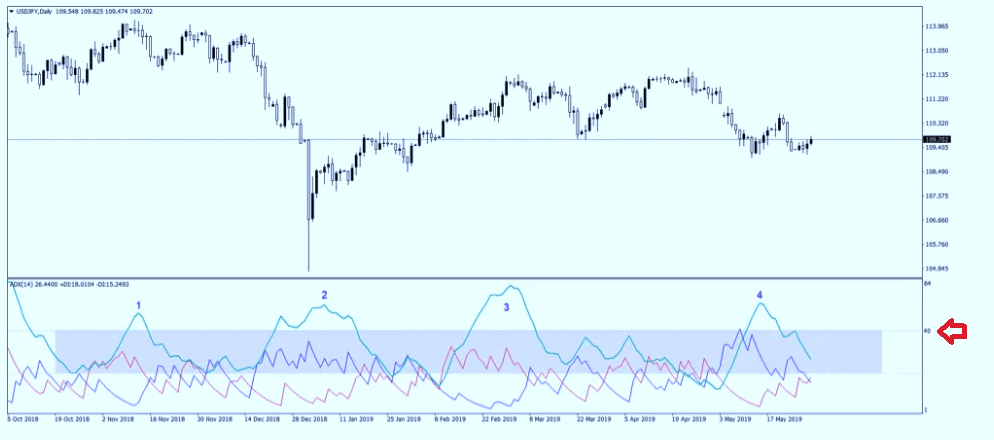
After this, the 40 level appears on the chart.

Traders should trend with the ADX only when it crosses the 40 level, where trending conditions are strong enough to act as encouragement for traders to set in.
It should be known that the ADX indicator is lagging. Traders should thus look to jump on a trend, making some pips on either an upward or downward movement. After entering a trending market, traders should look at reversal patterns to exit. The ADX indicator acts as a tool for finding out the above.
The most important aspect of the ADX is to provide the signal to trade. In the above chart, there are four instances where the ADX crossed above the 40 level. This is exactly where traders should use the ADX indicator.
Trading With ADX below 20
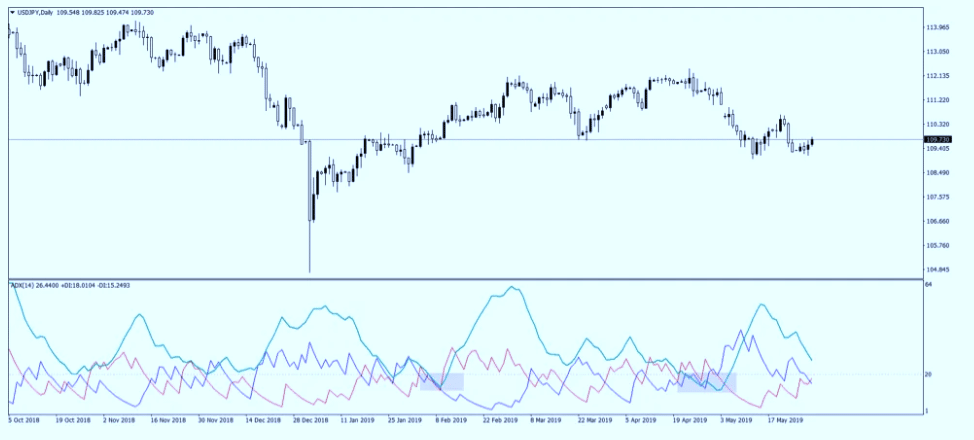
Just like in the previous case, the indicator has to be altered to insert the 20 level into it. As the key to trading with ADX is to interpret the ADX line with both the +DI and –DI, the 20 mark is critical.
Normally the rule states that the trend is considered weak when the ADX is below 20. When trends are weak, traders skip the +DI and –DI signal generated by their cross.

In the above chart for USD/JPY, traders will find that the ADX line has moved below the 20 level in two separate instances. The area between the 20 and the 40 levels as shown in the previous chart, has no meaning and is considered neutral. Traders should be more interested in trends that are formed when the ADX moves above 40.
Examples of Trading With ADX
When trading with the ADX, traders must either buy or sell when the ADX crosses the 40 marks. The red and blue help with the direction, either bullish or bearish.
It has been previously discussed that the ADX is a lagging indicator. In the above examples, the bearish or bullish signals appear much earlier than when the ADX moves above 40. Hence, the lagging is represented by the 20 to 40 area, or the time taken by the ADX to cross it.
Conclusion
Traders tend to avoid trend indicators like ADX because of lagging. They fear that they will end up entering too late into a trade, either at the top or bottom. It is certainly true that such situations arise when using lagging indicators.
However, experienced traders using ADX can use a filter to distinguish between signals that are worth the risk and false signals.


Leave a Reply