
Why do traders classify markets?
For market analysts, it is an invaluable aspect of trading to be able to concisely explain what is happening in the forex market by simply identifying market structures. Trending markets provide excellent opportunities for traders to increase their profit margins.
In contrast, non-trending markets typically provide traders with the opportunity to make a profit by purchasing low and selling high, with stops located at positions beyond the extremes.
The non-trending period is where technical traders will look to find changes in the overall direction of the market and/or confirmation that the trend they were following is about to reverse.
The trading strategy changes depending on the market type. Thus market classifications allow traders to follow an efficient market adjustment plan.
Trending markets
Trending markets can either be in the form of uptrends or downtrends. A trending market is one where pricing is moving in a constant direction.
An uptrend is characterized by price movement where highs and lows are getting higher.
A downtrend is defined by price having created a succession of lower highs and lower lows. In general, longer-term trends paint a clearer picture of the trading environment and offer more meaningful information than short-term data. Retracements are reversals in trends with shorter time horizons.
In the chart below, you can see the example of an uptrend.
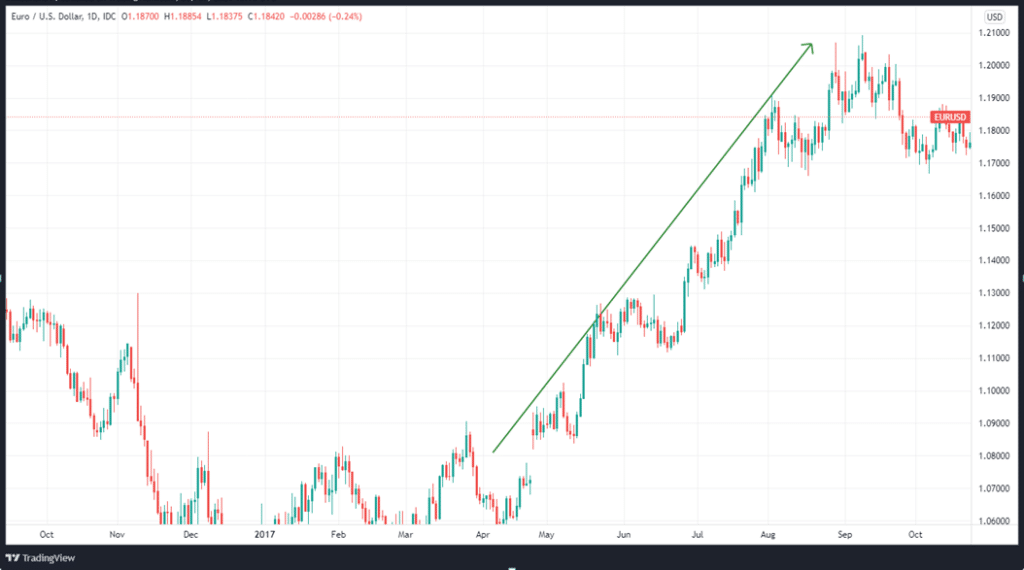
Trends have a wide range of durations, ranging from mere minutes to weeks or even months. Because most traders want to trade in currencies that follow trends, the major currencies and any other currency reliant on the dollar have advantages in being more liquid and less volatile.
When it comes to trend-based techniques, liquidity is critical. When a currency pair is liquid, it can move more actively.
Ranging markets
A range-bound market refers to the condition in which prices are confined to fluctuating around a given high and low point.
The high price, while still above the recent lows, is stopping the price from going any lower.
The low price is also seen as a strong support level where the price levels off.
Choppy markets are hard to trade since they lack direction and have no clue as to what’s going to happen next. A breakout can do more harm than good.
It is often more profitable to put more money in fewer positions in trending markets and leave the rest to the market. The inverse holds for choppy markets. You’ll have lots of trading setups and trading spreads throughout different price ranges.
How do you identify choppy markets?
We always want to be able to identify choppy markets. But how do you deal with this type of market structure? This is accomplished by identifying the high and low prices of the current market. That will mean a variety for you to choose from.
The orange arrows in the chart below show the period of the choppy market.
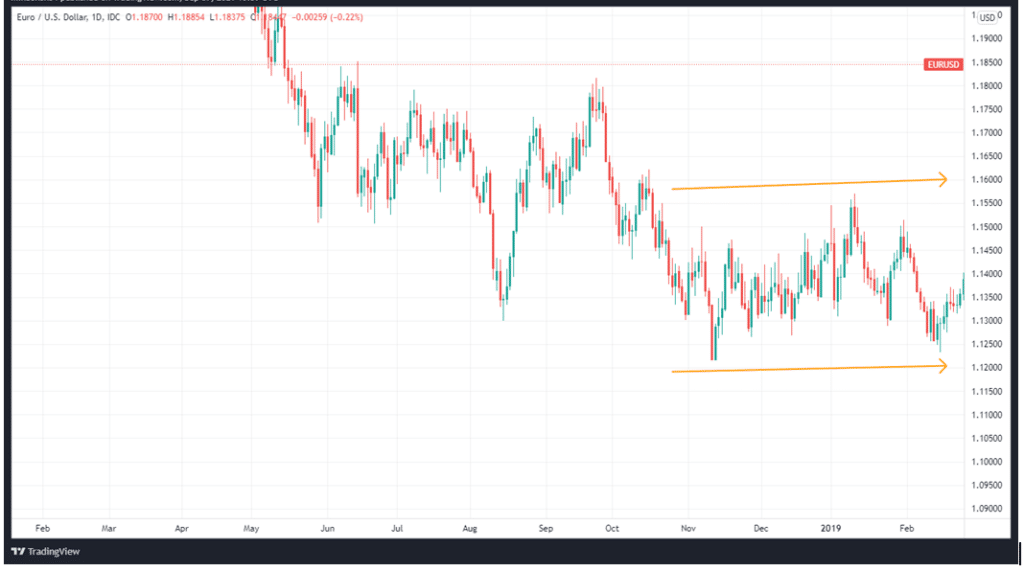
You’re then caught in an in-and-out trading game as the price fluctuates around that range. The market needs to break out of its trading range to give you any clue of what to do next. This will give you an idea about whether the market is likely to head up or down.
Consolidative markets
Usually, market consolidations take place after a prolonged period of trending markets or as a transition to a new trend. Regular consolidations may also occur before the rise of new trends or on extended market trends.
The market action slows down when everyone is uncertain of the direction, and no one knows who is going to lead the charge in price movement. Traders hold on to their positions in order to see how the price will fluctuate in the next movement.
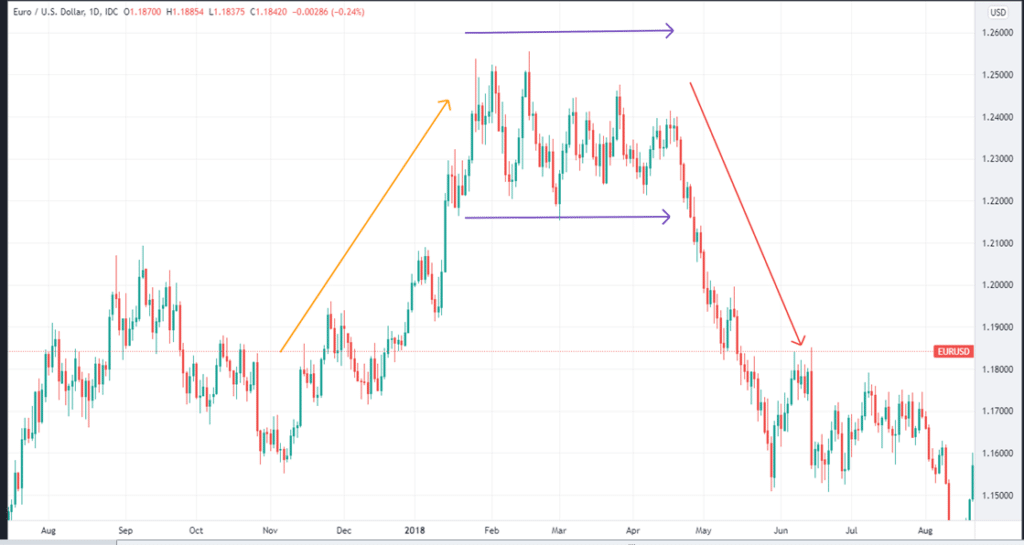
The chart below shows the uptrend (orange arrow) that turns into the consolidation (purple arrows), and finally, the market reverses and forms a downtrend (red arrow).
Traders who are highly focused can spot differences in order flow and volume and use these to identify opportunities for complex trades, such as trading when short-term consolidations are over and after clear breakout signals appear.
Normal bear markets
Normal bear markets are defined as types of markets that have seen asset value plummet by at least 20%. When the market is volatile and frequently trading near its lows, you will want to use important support as a point of exit. Alternatively, you can wait for the price to breach the previous lows before selling. This approach generally works better with shorter time frames.
Using this approach, we may break up our trading day by focusing on the shorter time frames in order to buy breakouts or sell rallies.
Traders should provide space for the retracements and avoid moving the stop to the breakeven only to limit risk.
Volatile bear markets
In the volatile bear market, rarely are there any retracements, and price does not often revisit old support. When the market is highly volatile, our best strategy is to use a tight stop loss and trade momentum.
The chart below shows a steep downtrend that doesn’t have significant retracements.
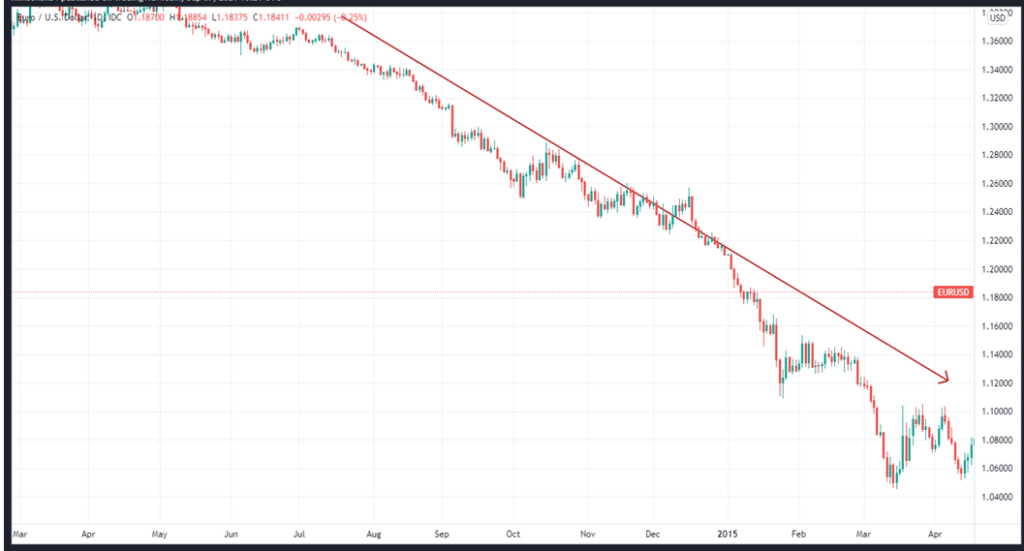
You should analyze shorter timeframes to find key support levels and then go short if you’re confident that price will break the level.
In summary
Markets can be classified based on the character of price movement or volatility. The types of price action in a market are what determine whether we refer to it as ranging, trending, bearish, bullish, etc. Importantly, each market type requires a proper trading strategy, depending on one’s objectives and the length of the trading period.


Leave a Reply