There is some good stuff happening in the economy that can feed the US permabulls’ zeal. The labor market has improved as the US Unemployment claims decreased again last week. Flash Manufacturing and Service PMIs were also positive not only in the US but in Europe too.
On the flip side, Joe Biden’s capital gains tax hike puts pressure on indices and arguably causes the selloff in the dollar.
DXY – technical view
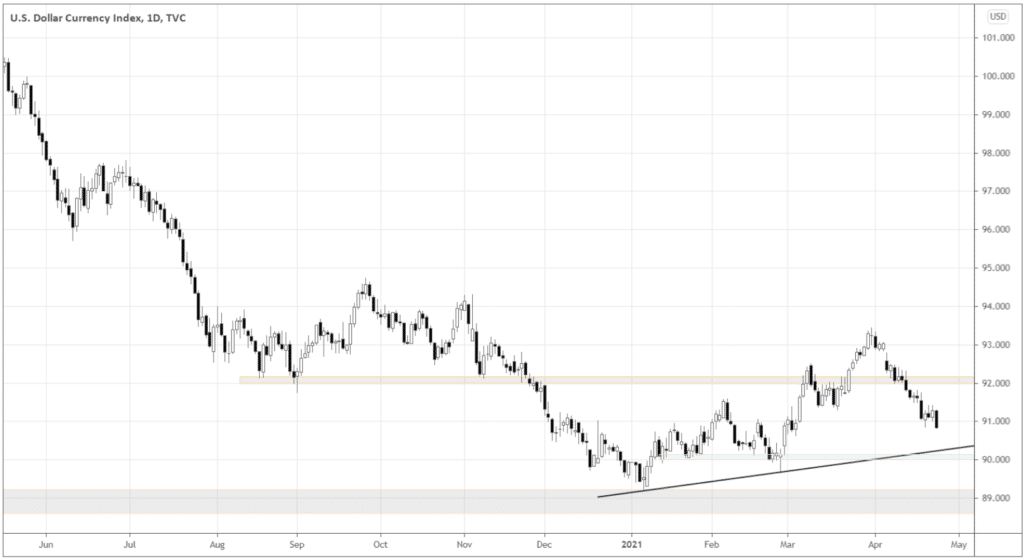
The dollar index continued the decline and is likely to remain weak in the following days. Why? The DXY chart below shows that there is still room for a free fall, as there aren’t any significant support areas at the current level.
The index may start bouncing up around 90.0, as there is an intersection of a horizontal support area and ascending trendline.

If the week closes below 90.0, the odds of the long-term downtrend continuation will increase. For now, swing and day traders are good to sell the dollar against risk assets.
USDCAD analysis
These days when somebody in power says that they’ll print less money, the markets really appreciate it and tend to bet on that currency. Investors are desperate for returns in a near-zero rates environment, so no wonder.
That’s what happened to CAD. BOC has decided to keep the interest rate unchanged at 0.25%, and governor Tiff Macklem officially stated that the central bank is tapering bond purchases. There wasn’t any ambiguity in the market’s reaction – USDCAD has crashed 1.37% within an hour.
I believe there is much more to it than the initial price impulse. BOC got ahead of other developed world central banks in terms of limiting the money supply. Consider European Central Bank. They don’t even think about any sort of tapering yet. Therefore, lasting strength in CAD may be in place.
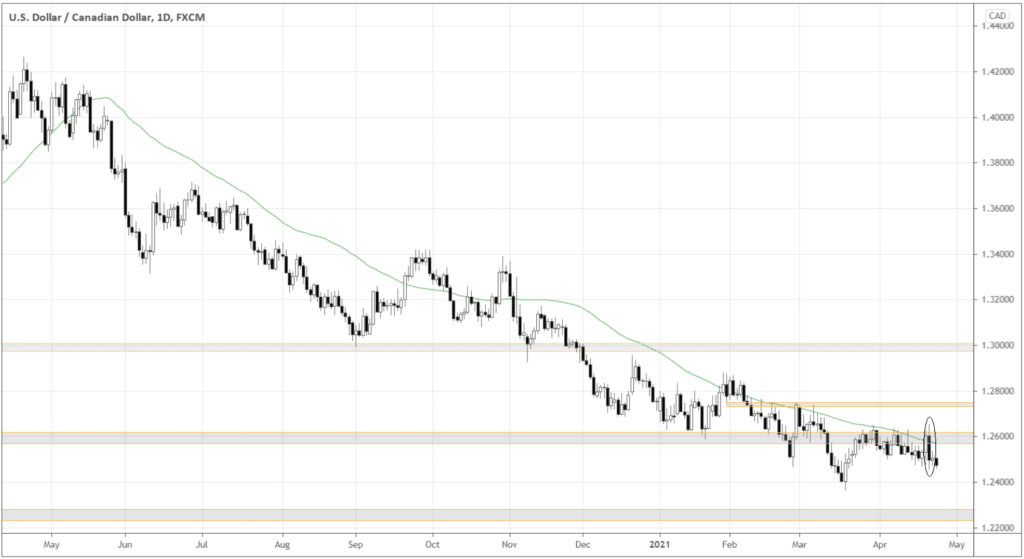
Let’s see what USDCAD technical picture tells us in the chart below. The circled big black candle is the rate decision day. The pair pierced the 50-day moving average before the event and subsequent crash – a strongly bearish price action signal.
If you look back, the market didn’t stay long above the moving average. Almost in all cases, the price made significant moves after returning below the green line. Will it be different this time?

There is a good downward move potential, as the closest long-term support is near 1.22. And of course, it’s very pleasing to follow the long-term trend, isn’t it?
What’s in favor of USDCAD shorts?
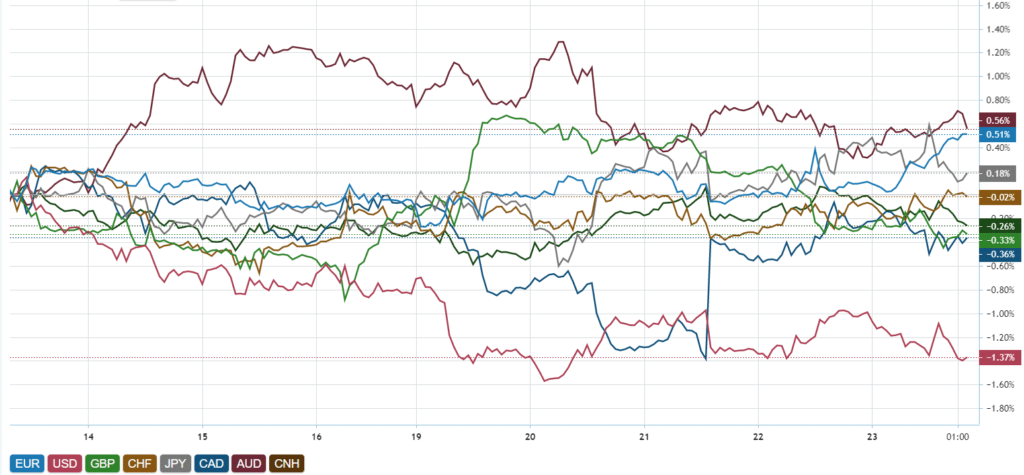
The US dollar is weak across the board on a relative basis. That’s an excellent environment to sell USD. The relative strength index below shows how the USD underperformed against all major currencies last week.

Don’t mind, though, that CAD is visually the second weakest currency in this chart. The difference with the top one AUD is just a few tenths of a percent, not a big deal.
Everything is relative. When currencies fluctuate within a half of the percent change, it’s a range, and CAD has it all to make up the gap. The USD is still 1% away, so there is only one real trend right now – against the dollar.
CAD is dependent on oil prices. Hence, the technical picture of the crude oil can help us define the change in CAD sentiment.
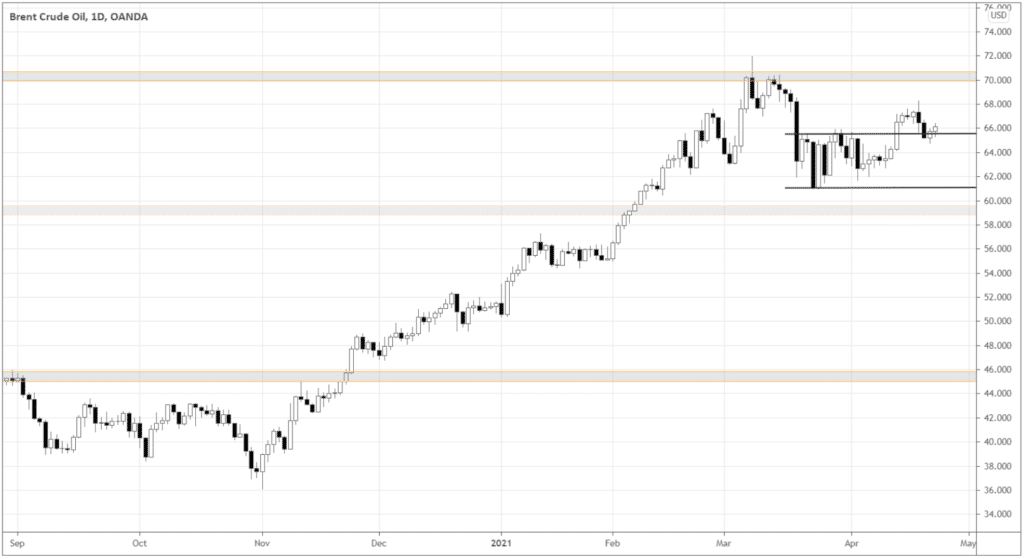
Brent chart shows us how the commodity broke out above the upper boundary of the range within the uptrend.

We want to see oil staying above 66.00 to consider the trend continuation becoming fuel for further USDCAD decline.
Conclusion
Although there is positive economic data from the US, a possible tax hike is dreading to risk assets. The sentiment is pressing the dollar, making it an ideal sell target. After the BOC’s rate decision and tapering monetary policy outlook, the market is bullish on CAD. USDCAD looks good fundamentally and technically for potential shorts.


Leave a Reply