- Industrial production in the US grew 1.4% in March 2021 against Russia’s at 1.1%.
- The price of natural gas on April 15, 2021, stood at 2.662 (+0.15%) from the previous day.
- US imports from Russia are expected to fall below $17.7 billion in 2021.
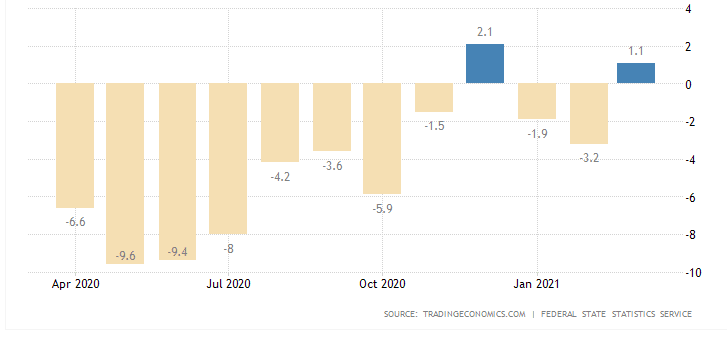
The USD/RUB pair closed at a +0.71% price change on April 15, 2020, from the previous day after the ruble lost ground against the dollar at 76.4242. March 2021 saw Russia increase its industrial production by 1.1% YoY and 12.2% MoM. The production had decreased by 3.2% YoY in February 2021. Manufacturing output contracted in January 2021, with mining and quarrying continuing at a sharp decline in the middle of Q1 2021. Storage of natural gas in the US from the latest release showed a 205% improvement from 20 billion to 61 billion.
Natural gas shortage
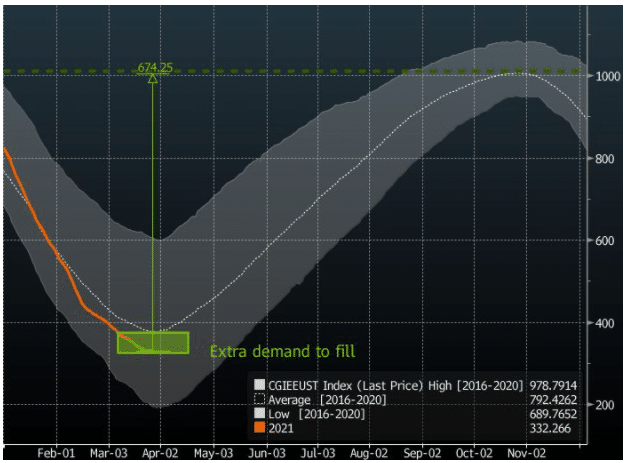
Cold winter in Europe disrupted the supply of natural gas, leaving facilities to grapple with a storage deficit of up to 25 billion cubic meters against that of 2020. Russia is expected to join Norway, Qatar, and the US to support the rising summer gas demand through April 2021. The countries need an extra 60% of gas capacity to fill the growing demand.
The gap is expected to increase through May 2021 if the temperatures remain low. Demand levels could reach up to 70 billion cubic meters (bcm). As of 2019, the consumption of natural gas had gained by 78 billion bcm (about 2%) below 2018’s growth rate of 5.3%.

Natural Gas demand to be filled
Global gas production into 2020 had inched up to 132 bcm (a rate of 3.4%). Production in the US accounted for two-thirds of the rise at 85 bcm. The price of natural gas on April 15, 2021, stood at 2.662 (+0.15%) from the previous day. Russia’s market share in the natural gas market is expected to hit 40% (from 30%) by 2040 due to dwindling supplies from Norway.
Industrial production

Russia’s industrial production
Industrial production in Russia rose from a 3.2% downward revision in February 2021 to 1.1% YoY in March 2021. There was a rebound in manufacturing output at 4.2% against 1.7% in February 2021. Energy output (electricity, gas, and steam) inched up 11% in March 2021 against 9.0% in February 2021.
Industrial production in the US also rose in March 2021 by 1.4% from a downward revision of 2.6% a month earlier. Cash flows from Biden’s stimulus plan added impetus to the surge, including factory/mining outputs and payment of utilities.
Factory output expanded 2.7%, while production of automobiles surged 2.8% in March 2021 after declining 10% a month earlier. Mines had a production gain of 5.7% that led factories and utilities to increase capacity to 74.4% in March against 73.4% a month earlier.
Sanctions
President Biden announced new US sanctions against Russia on April 15, 2021. The US accused Russia of conducting cyber-attacks and misdemeanors involving political interference. Among the impacts of the sanctions is the hardening of Russia’s debt capacity on an international scale. Already trade between the two countries dwindled in 2020.

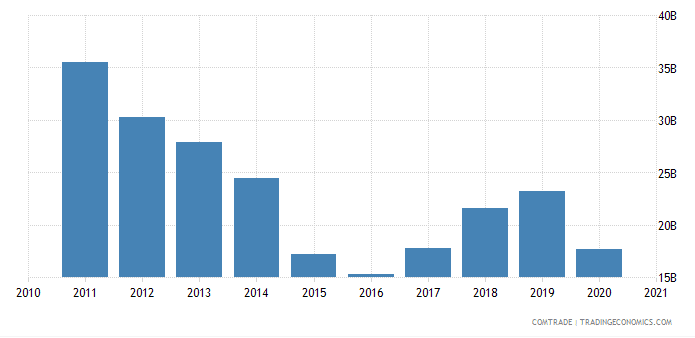
US imports from Russia since 2011-2020
US imports from Russia declined to $17.7 billion in 2020 from close to $25 billion in 2019. Bilateral trade hit an all-time low in 2016 when the US accused Russia of interfering with its electoral process. As of 2019, the trade deficit of the US against Russia stood at $13.1 billion.
Technical analysis

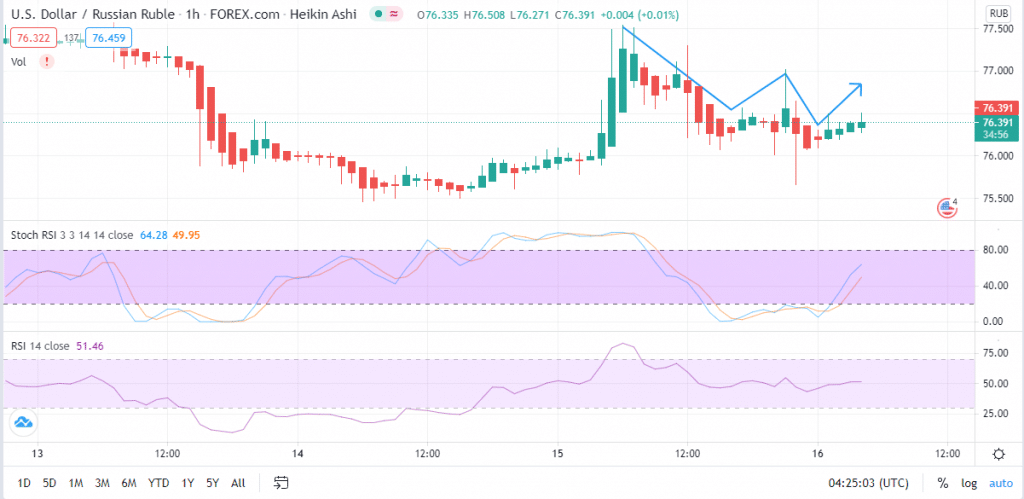
USD/RUB trading chart
The hourly chart indicates that the USD/RUB pair is likely headed towards the important support at 77.0000. There is increased buying activity among traders, with the 14-day RSI at 51.46. The stochastic RSI indicates the heightened momentum of the trading pair to continue with its uptrend at 64.28.


Leave a Reply