‘Trend is your friend’ is an important money-making hack in the capital markets. Trend trading is a popular trading strategy, as it is simple to read and understand. In addition, trend trading strategies have proved to be highly effective in generating significant returns while protecting traders from the impact of wild swings in the market.
Trend following strategies are simply strategies that encourage buying of securities when the price is moving up and selling when the price is going down. However, the strategy calls for the use of indicators among other forex trading instruments to determine the underlying trend as well as ideal entry and exit points.
How to build a trend following Strategy
Step 1: Identify the Underlying Trend
Spotting a long term trend is an important forex trading secret when it comes to trend trading. Markets trend upward or downward. Conversely, a number of indicators are often used to determine the prevailing trend.
Moving averages are at the heart of trend spotting in trend trading. For instance, long term traders or automated trading systems rely on long term moving averages such as the 200-day moving average to spot trends in the market.
Whenever price is above the 200-day moving average and keeps on moving up on pulling close to the indicator, price is considered to be trending up.
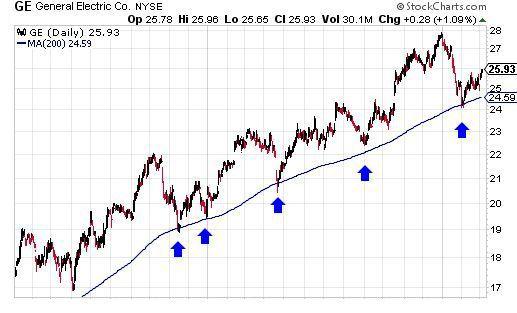
In the chart above, it is clear that traders, as well as forex expert advisors, opened buy positions, causing the price to move upwards above the 200-day moving average.
Likewise, whenever the price is below the 200-day moving average and keeps on edging lower on pulling close to the MA, the security is considered to be trending downwards. In this case, a trader can look for sell opportunities as price corrects up close to the 200-MA
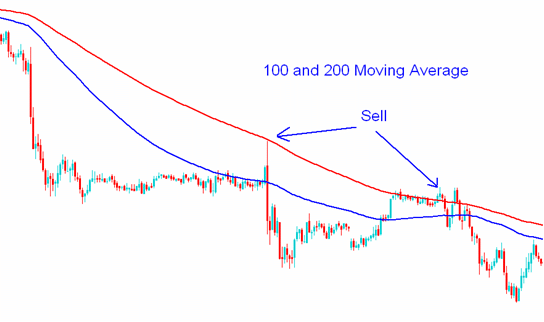
STEP 2: Find Entry Point
Spotting the underlying trend is the first step to trend trading. Once the underlying trend has been spotted, identifying entry and exit points should follow suit. Every trend trading strategy must have a way of determining when to open and close positions.
Relative Strength and Stochastic are some of the best forex indicators used to identify ideal entry and exit points for trend trading. The relative strength index comes with readings of between 0 and 100. Readings of below 30 on the indicator signal oversold conditions.
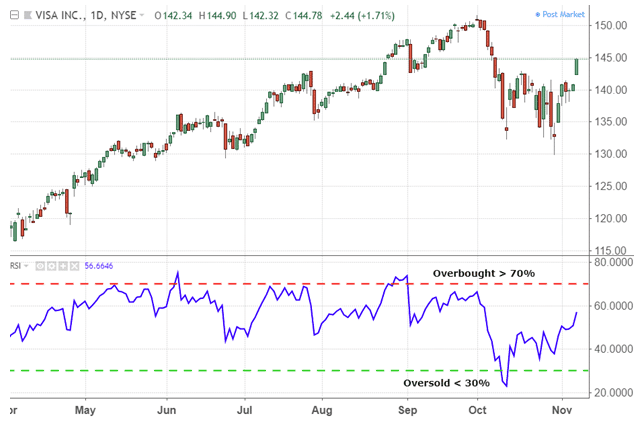
Conversely, if the RSI reading is below 30 and the underlying trend is an uptrend, you should focus on entering long positions. Price tends to reverse as soon as it falls for an extended period of time into oversold conditions.
Similarly, when the RSI reading is above 80, the same signals overbought conditions. In this case, you can look to enter a sell position if the long term trend is bearish.
The Stochastic indicator also operates the same way as the RSI indicator. Technical analysts and Algorithmic FX trading systems look for sell opportunities when the band reading is above 80 and buy opportunities when the band reading is below 20.
Use of Candlestick Patterns
Bullish Engulfing
A bullish engulfing is a two candlestick reversal pattern. The chart pattern forms when the body of the second candlestick engulfs the body of the first candlestick.
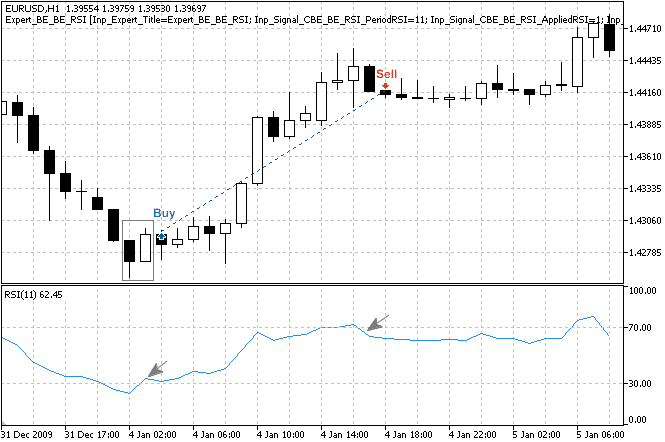
Whenever a bullish candlestick appears with the RSI indicator below the 50 marks, it signals that a bearish trend has reversed, and that price is set to move upwards. In this case, one or an FX Expert Advisor can look to enter a buy position upon the closing of the bullish engulfing candlestick.
Bearish Engulfing Pattern
Bearish engulfing is another important chart pattern that can be used to identify an ideal entry point in the market. The pattern forms when price moves up for an extended period of time. The pattern consists of a smaller up candlestick engulfed in a much bigger bearish candlestick.
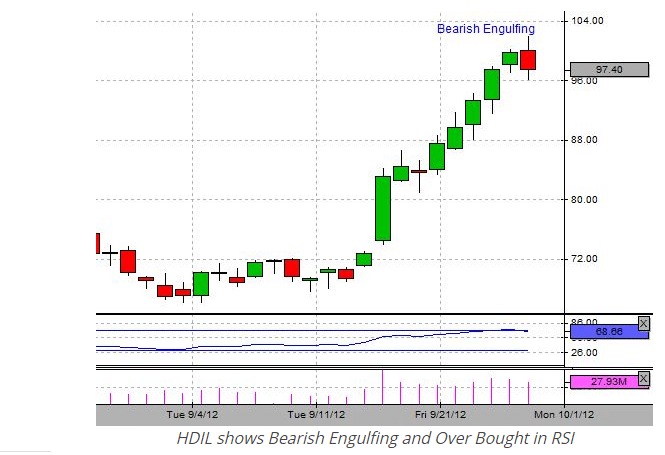
Whenever the pattern appears and coincides with an RSI reading of above 70, one should look to enter a sell position as the price is likely to edge lower.
Step 3: Identify Exit Point
While the focus is usually on the entry point in trend trading, an important forex trades secret calls for paying close watch to an exit point. The RSI or Stochastic indicators, when used with candlestick patterns, can also signal ideal exit points in the market.
For positional traders, ideal exit points in case of an uptrend is when the RSI reading is above the 80 mark, as the same signals overbought conditions. Similarly, in case of a downtrend, one can exit a position when the RSI reading drops below the 20 mark as the same signals extreme oversold conditions.
Conclusion
When it comes to trend trading, the idea is to determine a long term trend, open a position in the direction of the trend, and let the position run until the trend reverses.


Leave a Reply