
Markets aren’t fascinating these days. Although major stock indices closed positive last week, many still haven’t fully recovered from a current correction.
Currencies have also been mixed in terms of risk sentiment. US dollar tried to recover in the second part of the week, contributing to the ranging market’s state.
Speaking of the greenback, let’s look at what’s happening with the dollar index.
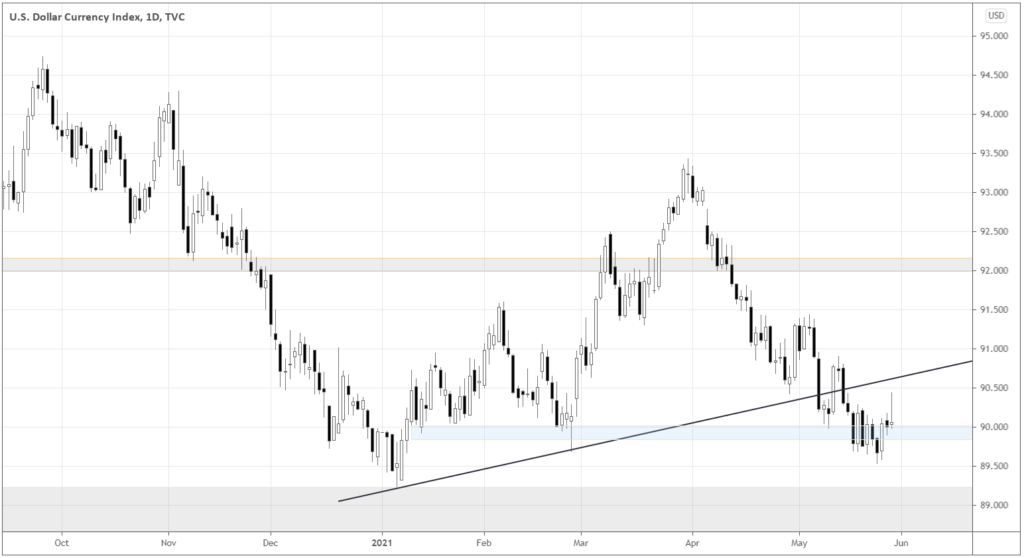
The index is retesting the local support around 90.0 after breaking the trendline. There is still a lot of work for dollar bears to resume the overall downtrend, as the area of 89.0 should provide intensive demand.
Look at the last Friday candle that formed a long upper shadow. Friday’s price action suggests that sellers are aggressively defending broken trendline and the prices around 90.50.
As the supply and demand areas locate tightly to the current index price, the dollar remains in a range.
The comments of Fed’s Janet Yellen helped to support prices of risk assets as the Secretary thinks that the soaring inflation is temporary and may last through the end of 2021.
Risk-on? – hold your horses!
The ratio of gold vs. copper is a good risk barometer. When people believe in the upcoming economic growth, companies are brave enough to launch production, thus requiring the raw material – copper. On the other hand, if the fear of uncertainty prevails among investors, people count on gold to preserve their wealth.
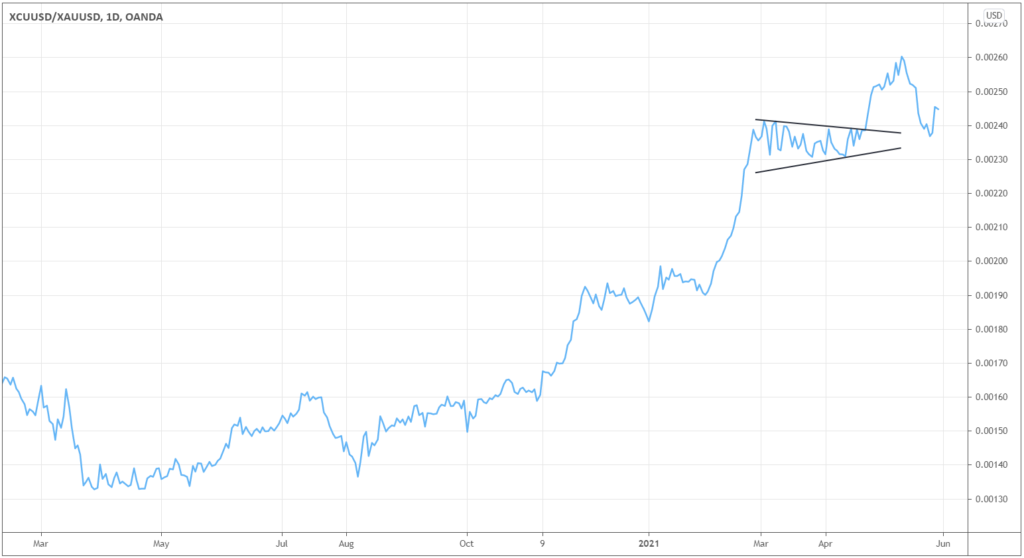
As the chart of the ratio above shows, copper managed to break out from the bullish flag against gold, suggesting that the risk show must go on, as the ratio saw an upward momentum through the middle of May. However, stocks and currencies remained directionless.
What does such a contradiction tell us? We know that commodities have been in a strong trend lately. Could the breakout be more of an inertia leftover and less about the reality of the risk sentiment? Other risk indicators such as AUDJPY didn’t manage to break out from the range.
Eventually, the gold-copper ratio got back to reality as it retreated into the prior range area. We can also see why it’s a logical time for the ratio to start struggling to advance when we zoom out a bit.
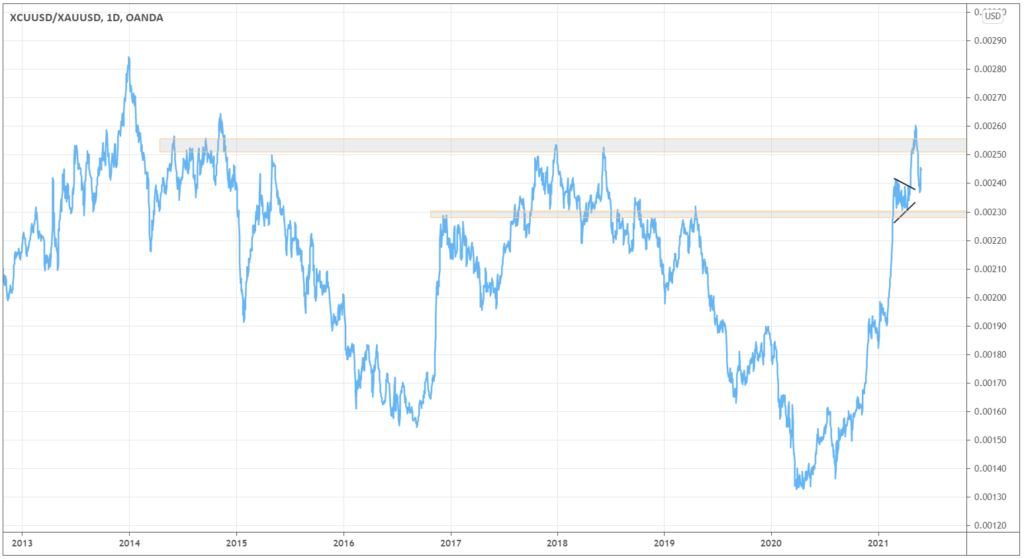
The ratio reached a serious resistance around 0.0025-26 and is now confined in a range with the down border of 0.0023.
Kiwi tries to break out from the range on RBNZ’s hawkish comments
It’s easier for active forex traders to get alerted of banks’ stance these days, as it gets pretty monotonous with all regulators trying to support the recovery by keeping rates low and printing money in one way or another. When there is a slight hint that things might change, the excitement comes back.
That’s what happened Wednesday, May 26th, after New Zealand’s central bank suggested a plan of raising interest rates in the second part of 2022. Such a hawkish stance surprised traders, and they rushed buying NZD, pushing NZDUSD almost beyond the current 0.715-0.730 range, as you see in the circled area of the chart below.
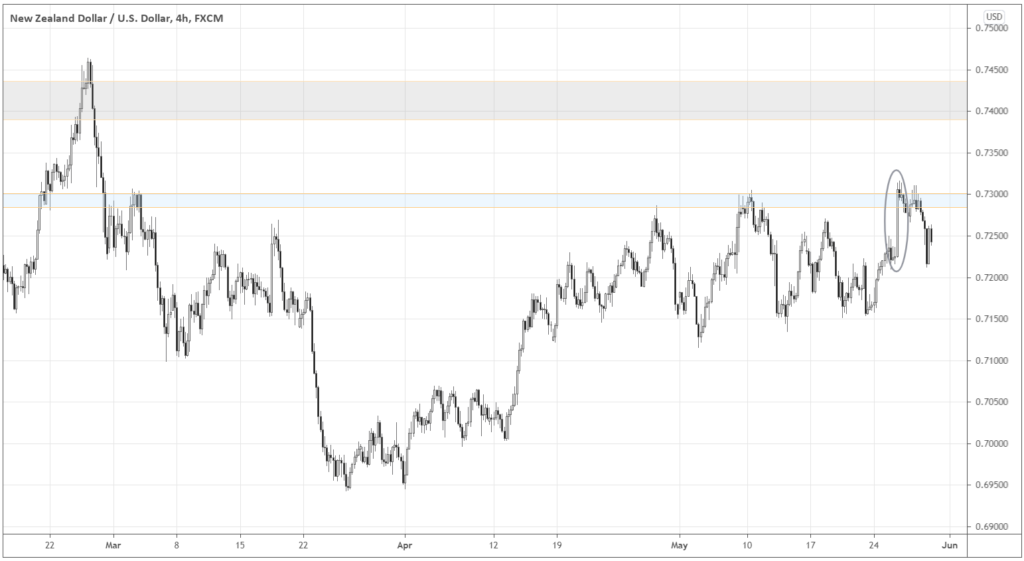
Later on, positive US economic data helped to subdue the NZD prices as US Unemployment claims, PCE Price Index, and Chicago PMI posted better than expected results.
The party for NZD might not be over yet. If we consider being bullish on Kiwi, let’s find something weaker than the US dollar.
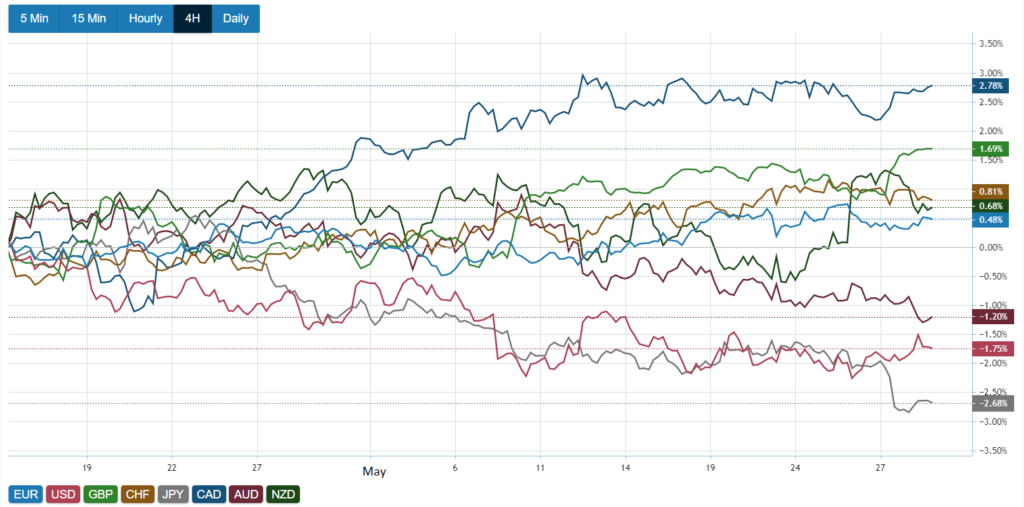
For the last month, the currency index shows that JPY (grey) has been getting crashed across the board, posting a relative decline of 2.68% against majors.
The high timeframe of USDJPY shows that the weakness in JPY might be the calm before the storm.
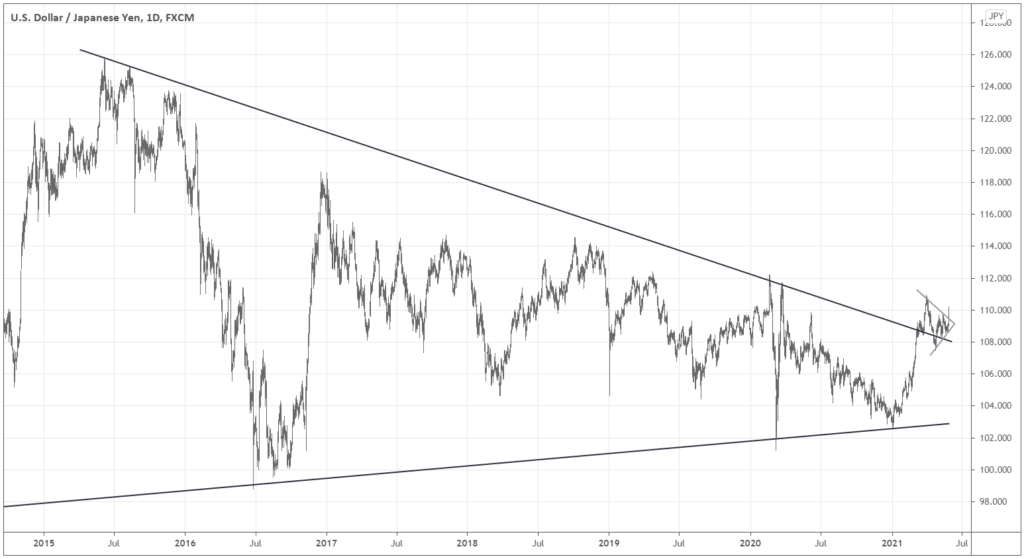
The years of JPY weakness might be on the way as the massive triangle pattern starts to break out up with prices closing around 110.0 – above the similar short-term triangle’s upper border.
NZDJPY offers a better setup to be bullish on Kiwi.
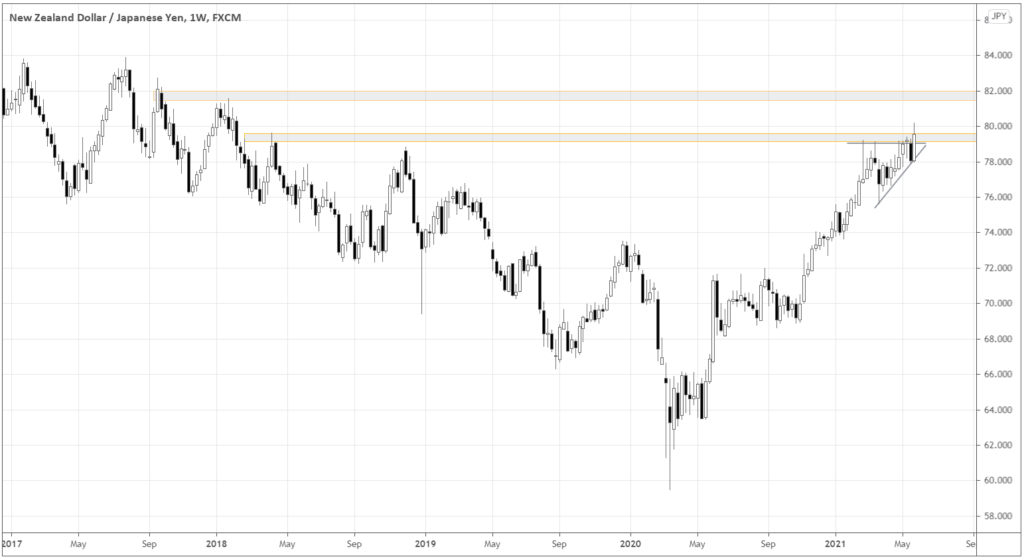
The last weekly candle confidently closed above the triangle’s upper boundary, suggesting a move to the conservative target of 82.0.


Leave a Reply