You want to pay attention to the US dollar in the week ahead, as the reserve currency closed the week with strength, catalyzed by positive US economic data. Technically the USD also looks attractive.
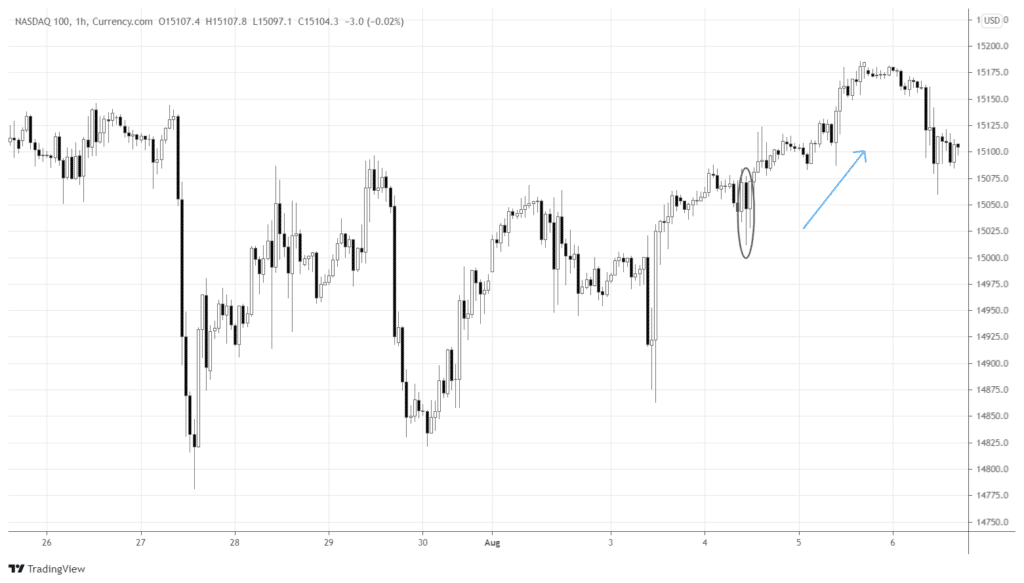
The strength of the greenback made risk-on currencies close the week negative. However, most stock indices still managed to end the week positive, including being wrecked by new policies Chinese benchmarks! Even oversupply in oil inventories and a 7.72% weekly decline in WTI couldn’t shake the stock investors’ sentiment.
Fed vice gave mixed comments on tapering, so the markets seem to be driven mainly by positive economic data from the US.
US data and market’s response
Fed members expect tapering to start at the end of this year-the beginning of 2022, and in late 2022 the economy might be ready for higher rates, according to Fed’s Clarida. When there is a lack of certainty from the regulator, it’s natural for the market to put more weight on the ongoing economic metrics.
Regarding Clarida’s comments, investors might focus on the time gap before any hawkish decisions from Fed, thus rushing to buy risk assets while the rates are still lower.
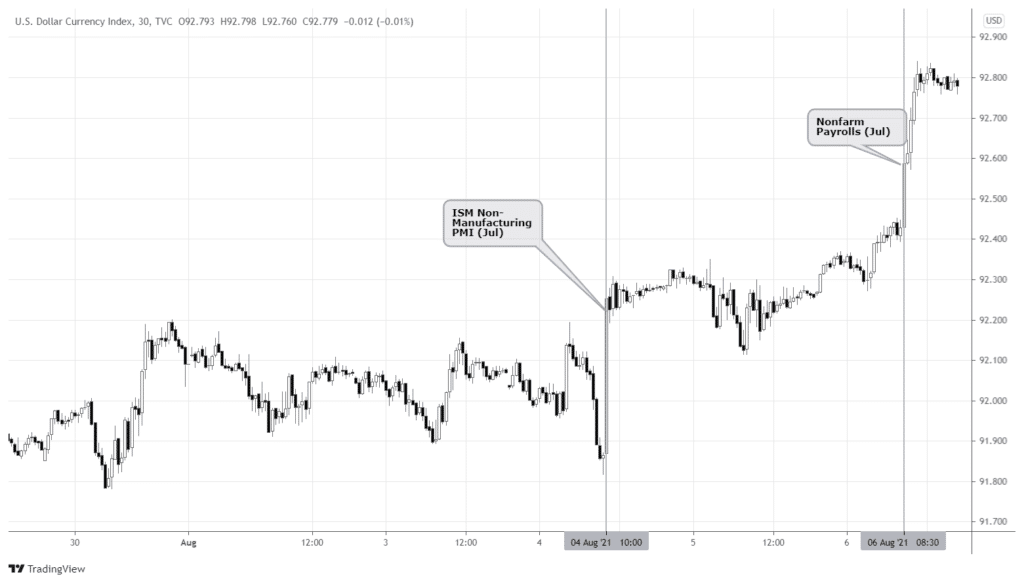
In the 30-minutes chart below, Nasdaq 100 kept rising after the ISM Non-Manufacturing PMI (Jul) showed an increase compared to the previous reading and better than expected results. The tech-heavy index kept rising after Clarida’s comments as well.

Nonfarm Payrolls (Jul) also beat expectations and grew overall. US dollar bulls loved the data released, as they pushed up the DXY on the 4th and 6th of August.

The dollar strength is clearer in terms of the risk sentiment: better economic data suggests more likelihood of tapering, and rate hike, eventually benefiting the greenback. We can expect the sentiment to persist in the upcoming week, driving the USD higher, especially if Core CPI (MoM) (Jul) and Initial Jobless Claims show better than expected results.
DXY technical picture
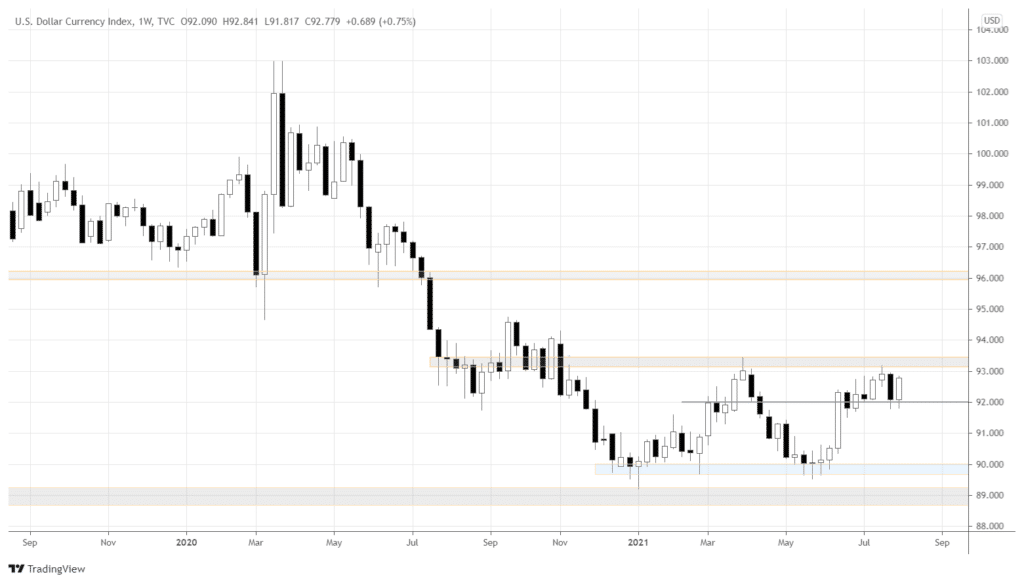
Let’s zoom out and see what the situation with the DXY looks like. Below is the weekly chart of the US dollar index. DXY stays within the 90.0-93.0 range.

As the first week of August didn’t manage to close below the short-term support 92.0, last week the index rebounded up, making up most of the losses from the beginning of the month.
The longer DXY keeps above 92.0, the higher the odds the market will take out 93.0 and break out above the upper border of the current range. If we’re above 93.0, the next target should be 96.0.
Next week I’d be focusing on the pairs involving USD, with the bullish bias on the greenback even before the major breakout. Let’s see what DXY will do as it gets closer to 93.0.
AUDJPY as the risk sentiment gauge
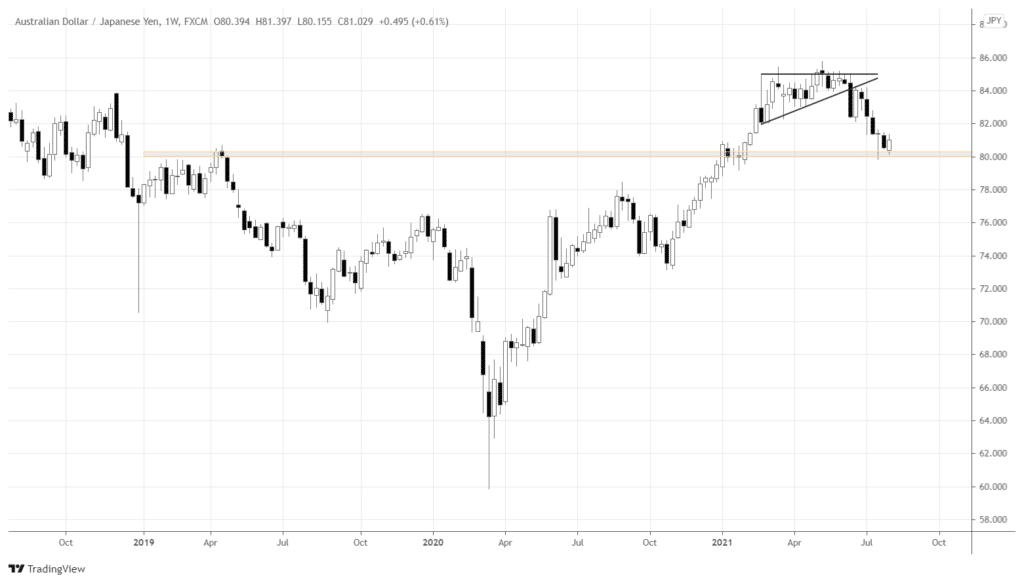
Let’s look at the assets, hinting at the risk sentiment. AUDJPY can give us information about the sentiment changes. When the pair grows, we’re likely in the risk-on environment. Conversely, if the pair falls, there is a fear out there, and we better buy safe-havens.
Below is the weekly chart of AUDJPY. After the uptrend started in April 2020, the market formed an ascending triangle that failed to resolve to the upside. Instead, the prices broke the down-border of the pattern and tumbled further. While the pair declined, we’ve been experiencing choppy price action in risk-on assets.

The pair declined to the long-term resistance-turned-support 80.0 and has been consolidating for three weeks. Notice that last week was the first week that closed positive since the end of June, so we have an extended downswing.
Also, the week closed above 50% of the first week of August, forming Piercing Line candlestick pattern. Piercing Line formation that’s sitting on the strong support is an excellent bullish signal. The chart suggests a possible start of the risk-on sentiment cycle.
Conclusion
Although Fed hasn’t been aggressively hawkish, the US dollar might be pricing in an upcoming tapering. Positive economic data from the US is another boost for greenback’s growth. The risk sentiment gauge, AUDJPY, suggests a possible turning point in the sentiment is near.


Leave a Reply