On balance volume (OBV) is an indicator used to measure buying and selling pressure. It is obtained by adding up and subtracting down daily volumes. Investors can predict trend continuations and reversals by using divergence or lack of it between prices and OBV.
How OBV indicator works
Joseph Granville first introduced OBV in 1963 in his book Granville’s New Key to Stock Market Profits, when he realized just how vital a role volume plays in tracking price changes in securities. Granville’s main concept was that volume comes before price.
The OBV is simply a total volume of up and down days in a given period. An up day is when a currency ends higher than the previous close, while a down day is when a currency ends lower than the previous close. When the volume on the up days exceeds volume on down days, OBV rises. When the volume on down days surpasses that on high days, OBV declines.
Positive volume pressure is indicated by a rising OBV; consequently, prices rise. Furthermore, a declining OBV indicates negative volume pressure, which results in lower prices.
When utilizing the OBV indicator, one should concentrate on the OBV line’s qualities. First, check whether the OBV’s trend reflects the price trend of the currency pair in question. Second, look for valid prior resistance or support levels. The OBV trend will alter as these are broken, and such changes can be utilized to generate buy or sell signals.
Since OBV is based on closing prices, only closing prices should be considered when searching for support or resistance breakouts. However, sharp volume spikes could throw off the indicator by causing a sharp move that would necessitate a settling period.
How OBV is calculated
The On Balance Volume is calculated depending on the previous close price. For instance, if today’s volume closes above yesterday’s volume, OBV is positive. Alternatively, if today’s volume closes below yesterday’s volume, the OBV is negative. Let us now look at the formula used.
- Case one. The current close is higher than the previous close:
Current OBV = Current volume + Previous OBV
- Case two. The current close is lower than the previous close:
Current OBV= Previous OBV – Current Volume
- Case three: If the previous closing price is equal to the current close:
Previous OBV = Current OBV
How to set up the On Balance Volume on a chart
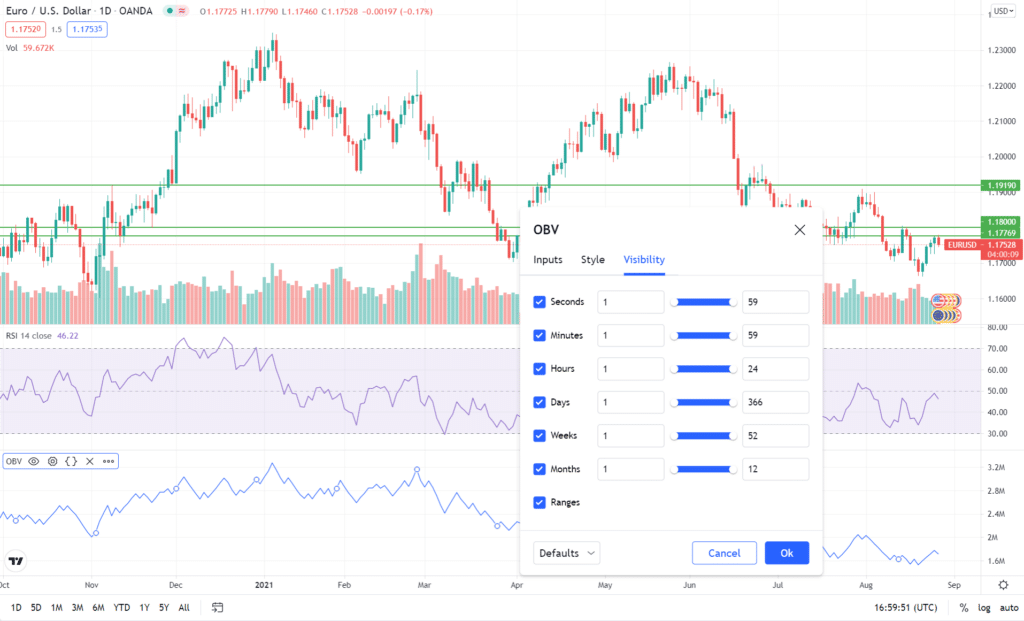
The OBV indicator comes with pre-programmed settings. The on-balance volume is adjusted with automated calculations. It does, however, allow for the customization of the OBV line’s color and thickness for a better user experience.
For example, the standard TradingView OBV allows you to alter inputs, color, thickness, precision, and visibility. It also allows the user to move the OBV box around to present their trading environment better.

One should note that it’s advisable to set an OBV indicator for a longer time frame. This is because lower time frames tend to be highly volatile, which exposes OBV to noise.
How to interpret the OBV divergence
Divergence happens when a currency pair price moves in one direction while the OBV line moves in the opposite direction. For instance, prices could be hitting higher highs while the OBV hits lower highs. This is a bearish divergence.
It will typically happen during a bullish run, and it signals the beginning of a downward reversal. This is because a falling OBV indicates that bulls are becoming more vulnerable to selling pressure.
During a downtrend, a positive divergence occurs when prices make lower lows while the OBV makes higher lows. It gives the indication that a bullish reversal is imminent. Bears are losing momentum as the OBV hits higher lows, and buying pressure is overpowering them.

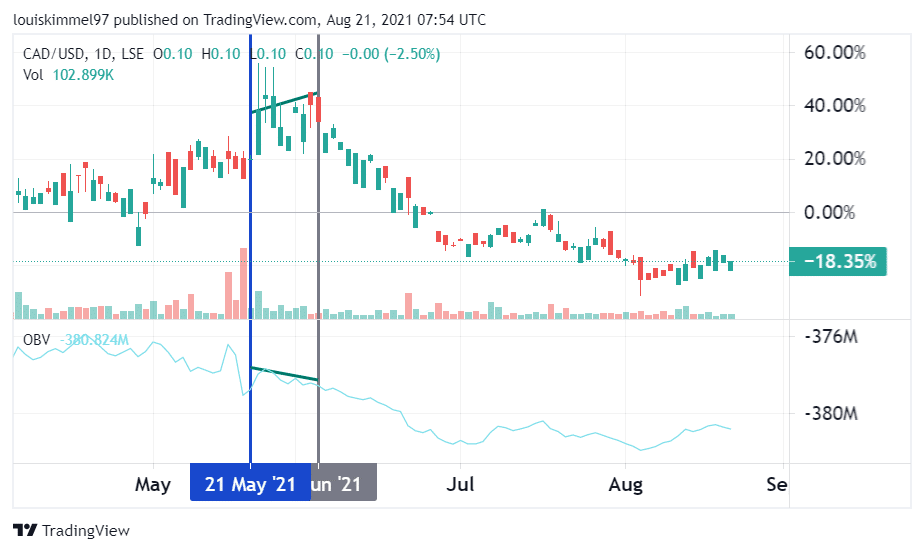
The CADUSD pair hit higher highs between May 21 and June 4, 2021, while the OBV indicator recorded lower highs. This divergence indicates that a bearish reversal is about to happen. The reverse occurred on June 4, 2021, when the CAD became weaker and bulls were forced to sell.
How to find the trend confirmation with OBV
Traders looking for a trend confirmation or attempting to forecast the strength and direction of an ongoing trend can utilize OBV. A trend confirmation occurs when the price of a currency pair rises or falls in lockstep with the volume.
Furthermore, a trend occurring in conjunction with a steep OBV line usually indicates that the trend is gaining strength. However, if the shift in slope is too dramatic, it could indicate that the trend is nearing its end, and a reversal is imminent.
The OBV indicator should be used in conjunction with the 20-period Moving Average for additional confirmation.

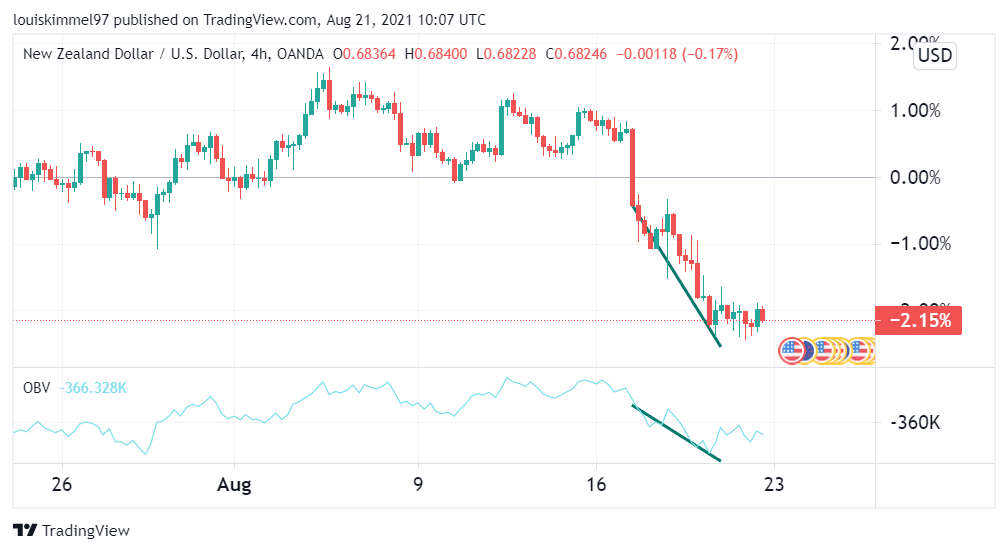
The four-hour chart above shows a bearish trend. The OBV inclines in the same direction as the falling prices, confirming the continuation of the bearish trend.
On Balance Volume (OBV) vs. Relative Strength Index (RSI)
Some traders use both the RSI and the OBV at the same time to obtain a better picture of what’s going on in the market. The RSI is used to determine oversold and overbought positions by measuring the magnitude of price fluctuations.
If the score is less than 30, it indicates oversold conditions, whereas a value above 70 indicates overbought situations. The RSI simply considers price, but the OBV takes into account both volume and price. OBV is good at displaying divergence, and when paired with RSI, the divergence becomes even more apparent.
On Balance Volume Indicator vs. Accumulation/Distribution
Because they’re both momentum indicators, the accumulation/distribution and OBV indicators are identical.
The A/D indicator examines whether a currency is being distributed or accumulated based on volume and price. OBV examines whether a currency’s closing price is lower or greater than the preceding close, whereas A/D examines the closing price across time and then multiplies it by the volume.
The A/D incorporates the driving forces in order to forecast price movements, but it excludes price changes from one level to the next. This could result in some oddities. When A/D and OBV are combined, traders get a clear warning of buying or selling pressure.
Conclusion
OBV is an indicator that can be used to assess selling and buying pressure in the forex market. When the positive volume exceeds the negative volume, and the OBV line rises, this is referred to as buying pressure.
On the other hand, selling pressure occurs when negative volume exceeds positive volume and the OBV line declines. OBV is also used by most traders to look for divergence, which indicates a trend change.
Conversely, a synchronization of OBV and price changes can be used to confirm a trend. OBV can be coupled with other indicators for improved outcomes, especially signal confirmations.


Leave a Reply