GBP/JPY is a pair that is favored by most Forex traders, since it combines the Japanese yen and the British pound, two of the most trusted and stable currencies.
In the year 2020, Japan and the UK entered a trade agreement that promised to enhance the trade between the two countries by more than 15 billion pounds. This is one of the many reasons why people are investing in this currency pair and why you should know about it.
Why is this pair considered to be strong?
This currency pair is considered to be strong for the same reason that it’s considered risky. It has extremely high volatility. This means you have the chance of winning big profits with this pair, but you can also lose a large amount of money.
If you don’t employ proper risk management and stop losses, you can exhaust your account within a few days’ time.
Traders who are new to the Forex market are often drawn to this pair because it promises to deliver a large number of pips. But if you are a novice trader, you’d do well to avoid it. Even a solid trading strategy can lose money swiftly due to volatility. During the consolidation phase, certain movements can absolutely crush your dreams of profits.
Factors influencing its price
The price of the GBP/JPY pair depends on the following factors:
- Changes in policies made by central banking institutions like inflation adjustment, change of bank rate, other modifications in financial policy, and decisions made by local authoritative bodies.
- Good and bad news reports about the currencies constituting the pair or about the countries to which they belong.
- The pair’s market sentiment.
Best time for trading GBP/JPY
The best time for trading this currency pair depends on the trading strategy that you are using. Since there are multiple factors influencing the price of this pair, you cannot expect to win a profit every time. As such, you should pay extra attention to managing the risks effectively.
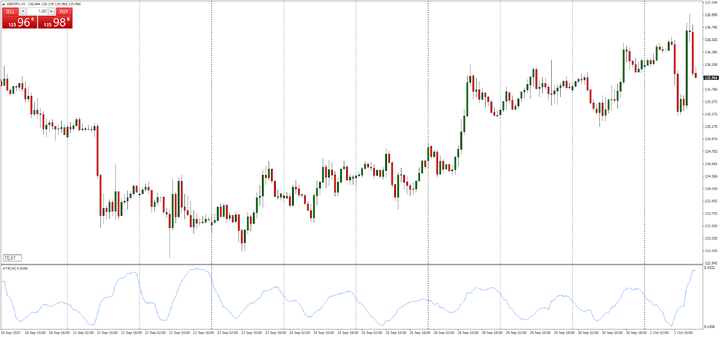
Nevertheless, there are some traders who make their entries when the market is highly volatile. In order to measure the volatility levels, they often take the help of the Average True Range Indicator. This oscillator is used for measuring the timeframe’s peak to trough and then determining the mean value.

Here you can see the Average True Range Indicator with a period of 14 plotted on the 1-hour price chart for the pair in question. Using the indicator, we can determine the mean range of the 1-hour bars for the previous 14 bars.
The beginning and end of a particular trading day are denoted by the vertical lines and it is interesting to note that the ATR experiences a small upward surge as each trading day commences.
This surge takes place at the opening of the European session when transactions in the GBP/JPY pair start being carried out. At the opening of this session, the Forex market experiences a rise in volatility.
Fundamental analysis
In order to carry out a fundamental analysis of this pair, you need to study the financial markets of both countries.
The inherent price of the currencies can be determined this way, and you can also predict in which direction the price ought to move in the days to come. You can conduct your analysis in multiple ways.
In the beginning, you can analyze the main socio political and economic factors. These include business dealings, employment, income, birth rates, death rates, and financial policies of institutions. At the same time, you must monitor the economic calendar on a regular basis, keeping an eye out for any occurrences that might influence the pair’s value.
For this purpose, it is important to analyze the recent as well as future economic data. You should keep in mind that apart from the economic events, you should also know how the trader sentiment is changed due to them.
Last but not least, you shouldn’t let emotions creep into your trading. Otherwise, you might jump into a trade based on a news release without considering if it is suitable for your strategy.
Technical analysis
You can use technical analysis on the GBP/JPY pair to determine in which direction its price might advance in the future.

For this purpose, you can use technical indicators, chart patterns, or candlesticks.
- Indicators tell you about price reversals, oversold and overbought conditions, trends, etc. For this particular pair, you can use a leading indicator to find out about future value changes. A lagging indicator can determine the momentum of the pair.
- Chart patterns are a great way to study long-term trends. It tells you where the value might be headed next, with respect to its past movement.
- Using candlesticks, you can see the movement of the pair for a particular period of time. Forex traders take the help of certain tools like Fibonacci lines and trend lines to point out the patterns.
How to trade GBP/JPY
You need to be alert at all times while trading in the GBP/JPY pair. Huge movements can occur in a flash of an eye, so a scalping strategy is particularly risky.

You should gain some experience trading in other pairs before you start dealing in this one.
It is wise not to overindulge and to keep the trades open only for a few weeks. Because of the highly volatile nature of this pair, you can lose a large amount of money before you even realize it. You should trade with small lot sizes and wide stop losses.
Conclusion
Although there are some inherent risks associated with the GBP/JPY pair, the rewards are also great. Once you start getting decent results, you may find that this pair is well-suited for your trading.


Leave a Reply