Whether you’re trading forex, stocks, or commodities, technical analysis (TA) is the one discipline any trader learns. TA uses identifiable chart patterns to predict future prices. Technical analysts believe that price action is not entirely random or chaotic.
Support and Resistance (SnR) is the 101 that newbies study within this framework before moving on to more advanced topics. SnR concepts may appear easy-peasy at first glance, though they are anything but!
This idea is entirely subjective, with many different ways of interpretations. Nonetheless, consider this article a stripped-down guide to getting you started.
What is the support and resistance in crypto trading?
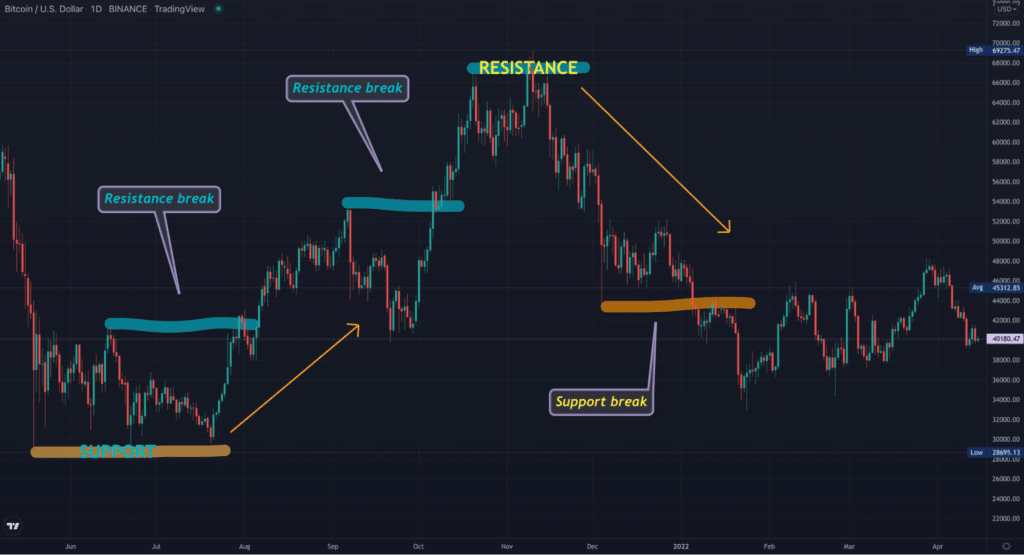
Support and resistance simply describe the elementary concept of how price levels find barriers in the markets. Support occurs when the price fails to break through a particular zone moving down, creating a ‘floor.’
Conversely, a resistance region happens when the market is unable to break through a defined zone moving up, resulting in a ‘ceiling.’ Price is constantly bouncing in between these floors and ceilings.
When the market manages to penetrate these areas, the function of that broken support will turn into resistance in the future, and vice versa (known as a support-resistance flip). When we have a downtrend, there will eventually be a level at which this momentum pauses, creating support.
At this point, there is an influx of buyers eager to buy a coin at this low price or sellers taking profits. On the flip side, a halt will ultimately transpire during an uptrend, generating resistance.
Here, we expect an inpouring of sellers looking to go short (sell) at this high level or buyers booking profits from the previous up move.
When price reaches a support or resistance, it will either pierce through it and move onto the next support/resistance or bounce back away and move in the other direction. Overall, crypto traders use these areas to anticipate the next move.

Additionally, these zones serve as places for entry and exit points. For a better illustration, we’ve drawn some key support and resistance on the chart below and addressed some of the other concepts discussed.
The different types of support and resistance in crypto trading
The support and resistance we described in the previous section is the basic form that occurs horizontally. Price can find barriers on a chart through other avenues, which we’ve explored further here.
Round/psychological numbers
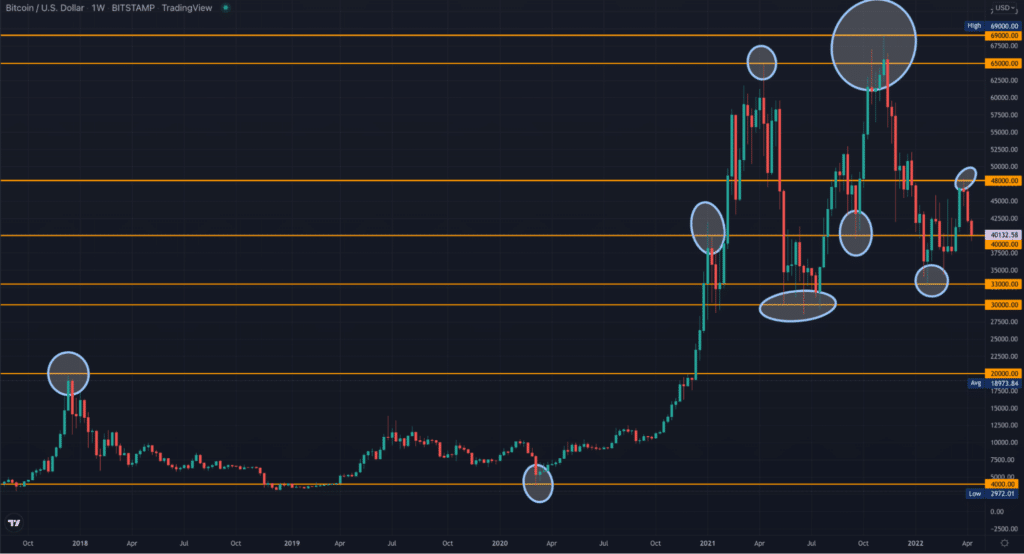
These are an extension of horizontal levels, referring to the tendency for a coin’s price to stall at prices with round numbers. This is a psychological concept based on how humans prefer rounding off values to the nearest zero for mathematical convenience.
The validity of so-called psychological numbers is questioned across financial markets. Yet, there is overwhelming evidence that prices find support/resistance at levels with zeroes at the end.

This is particularly significant if the number is a multiple of 5 or 10, e.g., 10 000, 55 000, 50 000, 60 000, etc. On Bitcoin’s weekly chart above, we have placed orange vertical lines on the round numbers. Note how the market behaved at each point.
Trendlines
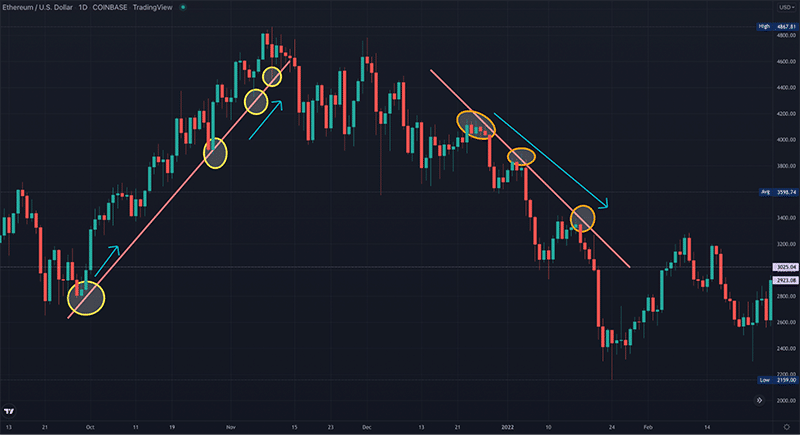
A trendline is another visual way to interpret SnR by drawing lines over pivot highs or under pivot lows to identify the predominant price direction. Even so, this method is highly subjective, considering that traders use different techniques to plot trend lines and that markets aren’t always trending.

Nonetheless, we have drawn two trendlines above on the Ethereum daily chart to show support and resistance levels.
Moving Averages
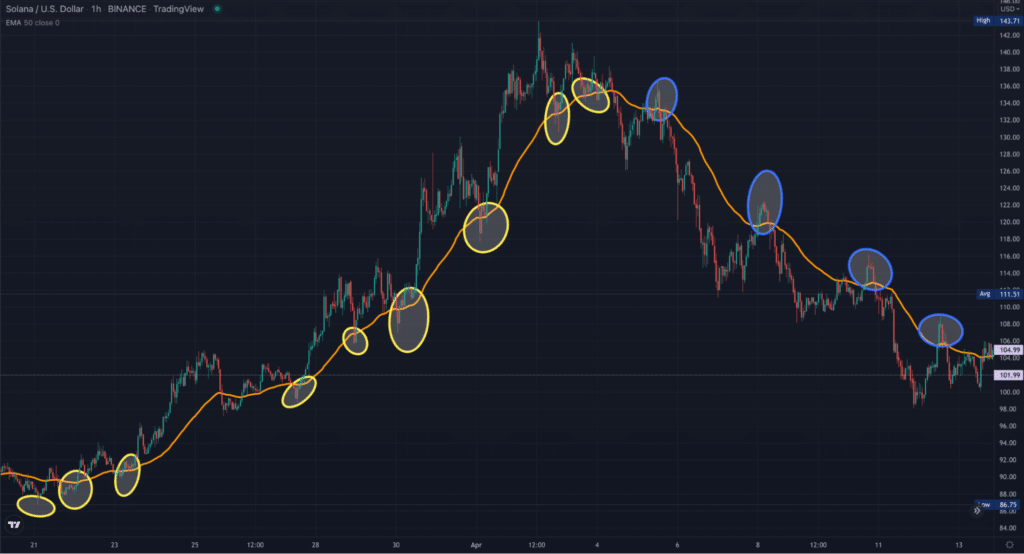
You could think of the Moving Average as a versatile trendline that doesn’t move perfectly straight. Traders identify points where price stalls on the Moving Average. This method is referred to as dynamic support and resistance.
Additionally, you can utilize the Moving Average as an entry trigger by waiting for the price to go above (to buy) or below (to sell) it. You can use any period of your choosing with Moving Averages, depending on your personal and time frame preference.

However, the most commonly utilized are the 5, 10, 25, 50, 100, and 200-day. We’ve used the 50-day Exponential Moving Average on the 1HR chart of Solana above, showing the pivot highs and lows with ellipses to signify how the price reacted at each point.
Tips on better finding support and resistance in crypto trading
Crypto investors use numerous techniques to identify potential support and resistance. Yet, we’ll discuss other crucial tips to understand this concept better.
- You should always think of SnR as zones instead of exact prices. When the market approaches a key level, it will often revert somewhere around it rather than precisely. This is where studying price action is integral.
It’s pretty common to see patterns like pin bars and the engulfing structures in these zones. This typically happens since many uneducated traders place their stop losses at such areas or believe the market will break out of a particular support/resistance.
- Price action is one of the best ways to judge whether previous support or resistance will hold or be nullified. If the market violates a support/resistance, it usually comes with a bullish or bearish candle with a big body and little or no candle wicks.
Conversely, if the market is reversing from such areas, you might see a small-bodied candle with a long wick (e.g., a pin bar) to suggest a false breakout.
Regardless, you must carefully observe how price reacts around these levels to determine the strength or weakness.
- Another essential tip is using higher time frames (from the 4HR and above) when marking support and resistance, which is particularly beneficial to long-term traders. You have many more lines to draw on the lower charts, making your charts messier.
However, higher time frames can show you the most significant zones with fewer lines.
Curtain thoughts
We should remember that support and resistance are more of a theory than a physical law governing the markets. Ultimately, the price of a cryptocurrency can breach any level it wants to regardless of any perceived barriers.
Regardless, traders form their own interpretations of SnR as fundamental to understanding how markets function. As with anything technical analysis-related, this is not the be-all and end-all since you must back up your trading decisions with multiple confirmation factors.


Leave a Reply