How Support and Resistance Levels work

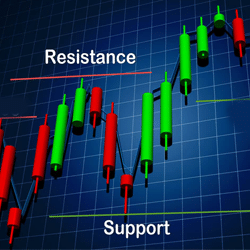
Support is referred to as a price level where a downtrend is likely to pause because of a concentration of demand or buying interest. While the price of currency drops, the demand for it increases and thus, buy orders flow form the support line. Resistance zones, on the contrary, arise because of selling interest while prices increase. The selling pressure stops the price from growth.
When the trader identifies a zone or area of support or resistance, he/she can use those price levels as potential entry or exit points. Keep in mind that after a price reaches a support or resistance point, one of two things can happen. The price either bounces back away from the support or resistance level or it continues in its direction by violating the price level until it hits the next support or resistance level again.
Some traders do trading by believing that support and resistance zones cannot be broken at the given period. Traders can bet on the direction of the price debating whether the price will stop at the support or resistance level or will break through it. It is a simple bet that can help them determine whether they are correct or wrong quickly with understandable risk and stop loss. If the price moves in the right direction, the move can be substantial. However, if it goes in the wrong direction, you will have to close the position.
Table of Contents
How to draw Support and Resistance:
You may follow these steps to draw support and resistance levels the right way:
Find the Next Major Support And Resistance Levels:
There is no need to draw all the support and resistance levels on your chart because that will create chaos like having too many indicators on the chart. Too many lines will make you miss the opportunities of good trades but with a few good lines, you will get clarity. So, draw just one resistance level above the current price level and one support level below. At this point, you do not have to be too concerned about being accurate.

Examine The Price Rotation Around A Level:
After drawing the lines on the chart, you need to examine if the positions are in the best possible places. To figure this out, see how many times the price hits the line. Adjust the lines a little so it hits the most points possible above and below.
Examine Historical Price Action:
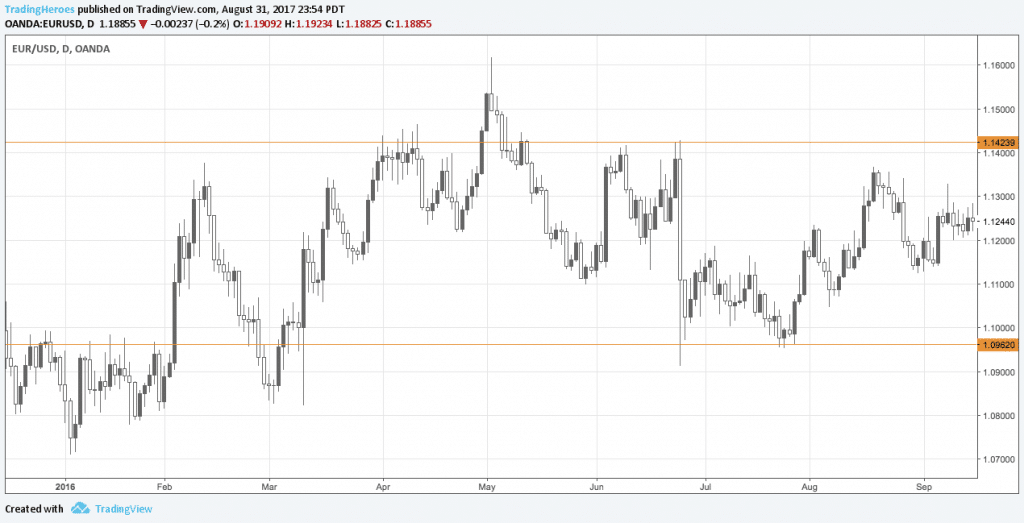
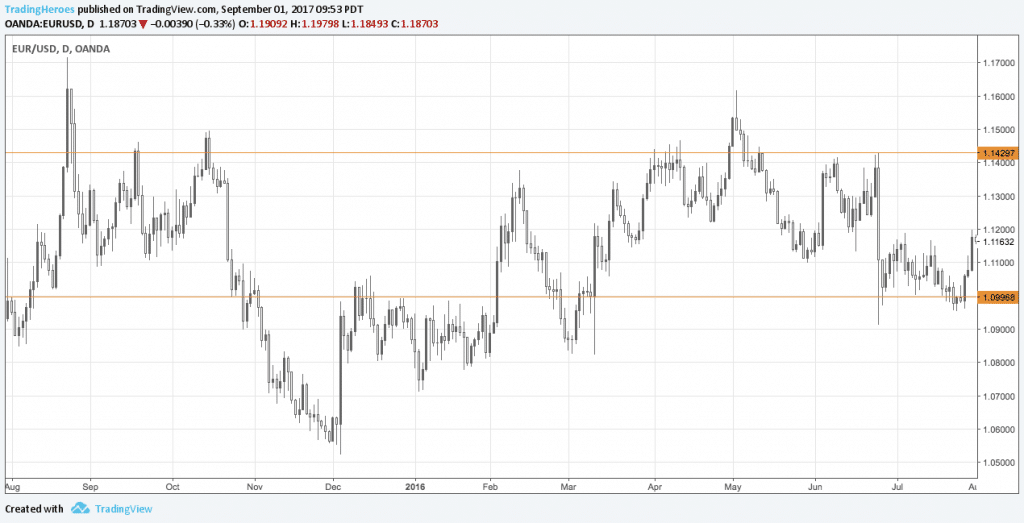
After you have adjusted your lines, scroll back on your chart, and see if the levels still make sense. There is no need to go back at the very beginning, just look at the recent history and check the next higher timeframe. If you see the first chart in this section, you can see that the support and resistance levels are still valid with older data. So, these are very good positions.

Repeat the process to find the next major levels:
Now, you can repeat the process and find the second set of support and resistance levels. These levels are required to give traders good profit targets and stop-loss levels. With them, you can make your next trading decisions for the currency pair according to support and resistance.
How to use Support and Resistance for trading:
You can use support and resistance for trading in the following ways –
Trendlines:
A constant level can prevent the price of an asset from moving higher or lower. When it comes to support or resistance, the static barrier is one of the most popular forms. However, the price of financial assets usually trends upward or downward. So, it is common to see these price barriers change over time. This is why trendlines are important in trading with support and resistance. When the market trends upwards, the price action slows and moves back toward the trendline. This is when resistance levels form.
It happens due to profit-taking uncertainty for a specific issue. The price action goes through a plateau effect and creates a short-term top. Many traders pay close attention to the price of a security when it falls toward the broader support of the trendline. This is important because historically, this is the area that prevents the price from moving substantially lower. For instance, you can see in the chart below that a trendline provides support to an asset for several years. On the contrary, when the market trends toward downward, traders watch for a series of declining peaks and use a trendline to connect these peaks. When the price reaches the trendline, most traders consider entering a short position because this area pushes the price downward.
Round numbers:
A common characteristic of support and resistance is that the price of an asset can find it difficult to move beyond a round number, like $50 or $100. Inexperienced traders mostly go for buying or selling assets when the price is at whole numbers because they think that these levels value a stock fairly. However, if so many traders place orders at the same level, the round numbers act as strong price barriers. For example, if all clients of an investment bank place sell orders at the same suggested target, it would require an extreme number of purchases to absorb the sales. As a result, a level of resistance forms.
Moving Averages:
Technical traders incorporate various technical indicators like moving averages mostly to predict forthcoming short-term momentum, but they do not realize the ability of the indicator to identify the support and resistance levels. You can see in the chart below that a moving average changes line constantly that levels out past price data and also allows the trader to identify support and resistance. When the trend is up, the price finds support at the moving average. Similarly, when the trend is down, it acts as resistance.
Apart from moving averages, many indicators can identify barriers to future price action. You can use support and resistance with these indicators. It may seem complicated at first, but practice and experience make it easier.


Leave a Reply