
Introduction
The measured-move up (MMU) pattern is a 3-part formation in a stock chart where prices go up, then follow through a retracement before it proceeds to go up again. It describes a long-term bullish reversal. It is the opposite of the measured-move down that occurs as a long-term bearish reversal. The MMU formation begins first with a bullish reversal – then it proceeds as a continuation after the corrective phase. It takes several weeks and, in some cases, months to form this pattern.
Identification
1. Preceding downtrend in price
The MMU pattern is formed after a downtrend in prices. The first leg begins with a bullish reversal. The decline in prices takes weeks to almost a year before it starts the bull-run. Figure 1 shows an analysis of gold futures from 2018 through to 2021. Prices hit the annual low of $1,238.76 before they began to rise to $1,735.20. We can conclude that the MMU formation begins from yearly lows.
2. First leg (A)
This is the first uptrend in prices that follows the yearly low downtrend. In figure 1, the first leg-A rises from $1,259.70 to $1392.30. This first leg also acts as the reversal advancement marking the first change in the price trend. Prices break above the established resistance.
3. Corrective phase
This phase describes a retracement or a decline in prices from the established upward first-leg movement. In figure 2, the first leg, A, has moved up by $132.60. The corrective phase has declined by 42.85% of the first leg’s movement. In many scenarios, the decline in prices of the retracement phase ranges from 40-60% of the first leg movement.
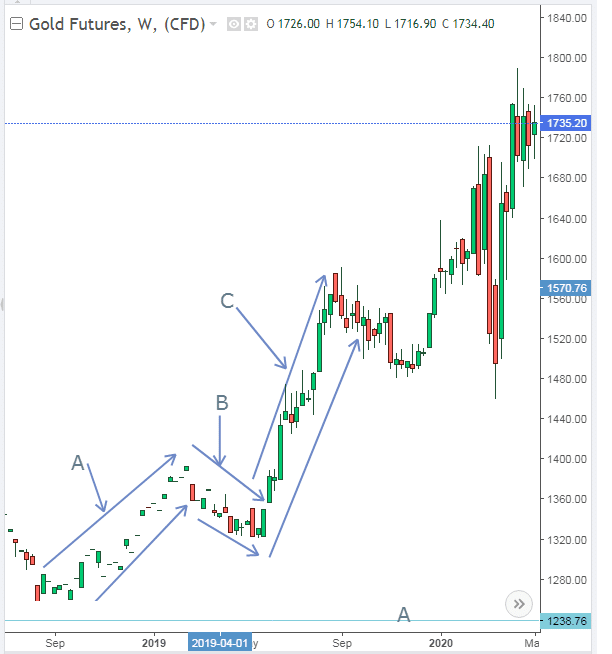
Figure 1: Gold Futures
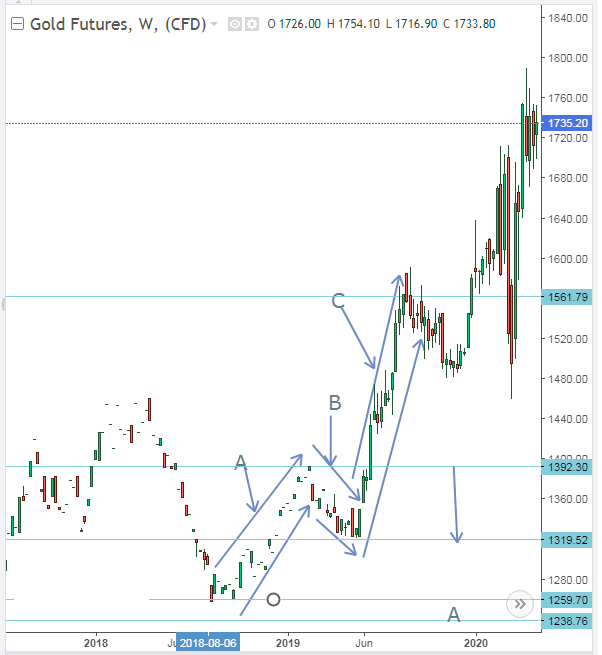
Figure 2: Retracement
The retracement seen in figure 2 takes the form of a sawtooth with slight rise and fall patterns. This form of correction shows that the second leg is headed for a longer climb as compared to the first leg. There are sharp retracements and sharp declines before the breakaway pattern is identified.
4. Second leg (continuous advancement phase)
It is the second rise in price after following the retracement. The length of the climb is dependent on the sharpness of the retracement. Prices, as seen in figure 2, fit in the channel as they rise. The second leg rose 18.36% from a low of $1,319.52 in June 2019 to a high of $1,561.79. Most traders would make between 15-20% of their earnings if they went long at the end of the retracement.
Notes to consider
The measured move up pattern did not have a double top between the retracement and the second leg. This formation destroys the upward trajectory. The trader should short the stock if he finds the double top.
Additionally, any rise that is not supported by a strong volume of candlesticks may not be sufficient to sustain a bullish trend. Low volume indicates lower buying pressure by investors. Prices easily tumble when there is low momentum below the second leg.
Another point of concern is that the trader should be quick to analyze the height and movement of the retracement before initiating the trade or buying the stock. Prices in the corrective phase should fall between 40-60%. A decline of 15% or below (of the first leg’s movement) should not be considered as an absolute indication of a breakout. In fact, the rise in price after such a short decline is mostly termed a false breakout.
Trading strategy
1) Set the target price by adding the difference between the highest price of the second leg and the retracement level. For example, in figure 2, set the target price by subtracting $1,561.79 with $1,392.30. Add this difference to $1,561.79. The target price should be around $1,731.28-$1,760.
You can also choose to use the lowest point of the retracement level to spice up the trade. But you should set up the stop loss just in case. However, ensure the Fibonacci retracement does not fall below 61.8%. The retracement should be at least 32.8% for optimal results. Remember that the Fibonacci retracement ranges from 23.6% to 78.6%. The candlesticks used should be set on a 30-60 minute (1 hour) timeframe for a good analysis of the market swings.
2) Buy after the breakout
Place the buy option after establishing that the length of the retracement level is proportional to the first leg. In figure 2, the buy option should be at $1,319.52. The lowest point of part C describes the breakout position. Take your profit when the stock rises to the highest point at level C.
For optimum results, you can draw a trend line sloping downwards against the corrective phase. Place the buy option after the price rise and close above the trend line. Also, you should not be quick to sell the stock once you hit the target price. At times, prices continue to rise even after surpassing the target price. You can wait and see the volume of the declining prices. If the prices pause (after the second leg) below the target price, it is important to consider selling. In case you want to delay and observe price movement, place a stop loss at least ten pips below the target price.
3) Keep track of the support and resistance levels
The corrective phase provides the support or resistance level in an MMU. In the case of figure 2, prices rise and form another retracement phase after the second leg. You can use that to create psychological support or resistance depending on the price trend. In other cases, prices decline all the way from the price target to the retracement level. It is important to sell the stock or put a stop loss if unsure. In the case of figure 2, prices found support at the second retracement level. You can buy the stock again.
Conclusion
This article describes the identification of the measured move up pattern. It is applicable in a bullish trend line. It is a three-part formation where the increase in prices is proportional to the leg movements. It works opposite to the measured move down pattern that is common in a bearish reversal.


Leave a Reply