Introduction
A broadening bottom is a chart pattern formed by two divergent horn-shaped lines moving between horizontal and vertical directions. The shape forms a symmetrical triangle or a wedge that increases over time. They describe a short-term bullish reversal from a bearish trend. The price action of the stock opens outward after it begins forming the broadening bottom.
There is high volatility within this wedge-like pattern, especially since it was formed as prices were falling. At this point, it can be said that investors are nervous, and the random movements need to be spotted early to start the trade.
Identification of the pattern

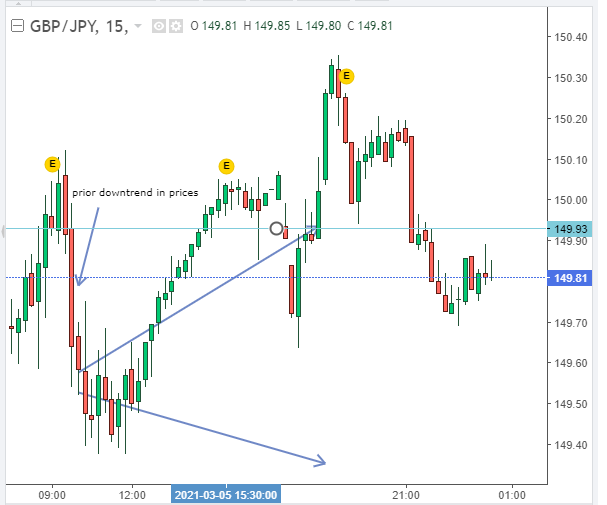
Figure 1: Hourly Chart Showing a forex trade (Intraday)
For educational purposes, we will use this hourly chart of the GBP/JPY (British pound vs. Japanese yen) to illustrate how to identify the broadening wedge.
1. Prior price movement
A point to note is that the prior price-trend before the formation of the cone-shaped wedge is a downward price movement. This factor is important as it will distinguish a broadening bottom from a broadening top. At the top trendline (the upper price movement), the price moves higher, i.e., higher highs, while at the lower trendline, prices move downwards or the lower lows.
2. Breakout
In our case scenario, there are two upper breakouts and one downward breakout gap. This means that the trader will focus on buying this currency pair at this moment as opposed to selling it. The date of this transaction is March 5th, 2021. The upper breakout indicates the resistance level. So, the first upside breakout occurs at 149.70, and the second is at 149.93 (see figure 1). These two resistance levels show where the trader can initiate the buy positions. If the price moves above the resistance level, the trader will buy the pair as opposed to selling or shorting it.
The downward breakout shows the support level. In our example, we are using a daily chart whose support on March 5, 2021, was at 149.50. The trader should not initiate a sell position when the price moves above this support level.
The breakout will occur after the price extends beyond the boundaries of the trendline. The trader will notice that the prices will follow the trendline for a lengthy time as they push through the level.
The trader will go long after prices cross the support level (in the upside), where the breakout begins and make a short (sell) position after it goes below the resistance.
Let us consider a long-term approach to our trade and focus on an annual analysis.
3. Annual chart analysis with the partial decline identification

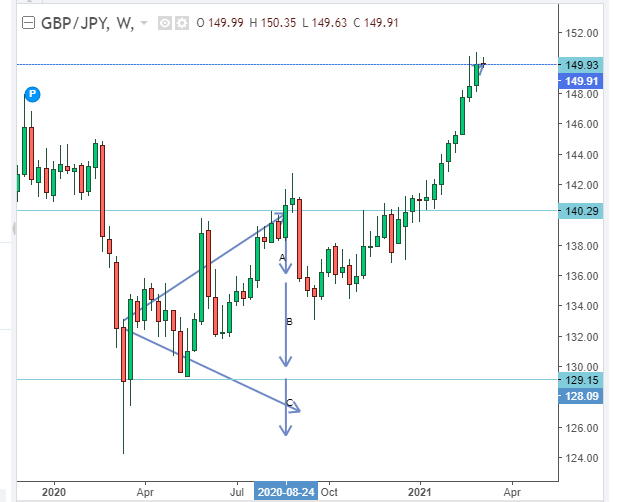
Figure 2. One-year Chart of the GBP/JPY forex pair
- The broadening bottom pattern formed in April 2020. The trading pair fell from 144.00 to 129.15.
- Increasing volatility indicated the beginning of the wedge or broadening bottom formation.
- Resistance first formed at 136.00 and later at 140.29. When the pair broke the 136.00 resistance, it became the new support. A trader could have initiated a buy position and observed the trade as it moved towards the 140.29 resistance on August 24, 2020. It broke this level in January 2021 and proceeded in a constant uptrend until it reached 149.93. This position is significant since it illustrates maximum benefits to the trader as far as the buy hold is concerned.
- The pair did not break the lower support line held at 129.15. Any move below this position, would signal to the trader the need to sell or short the trading pair.
- We can see a partial decline immediately after the breakout occurs at 140.29. Prices decline 3.77% and move towards 135.00. The partial decline provides a signal to the trader to prepare for a strong bullish uptrend, as seen in figure 2.
4. Price movement analysis and forecast
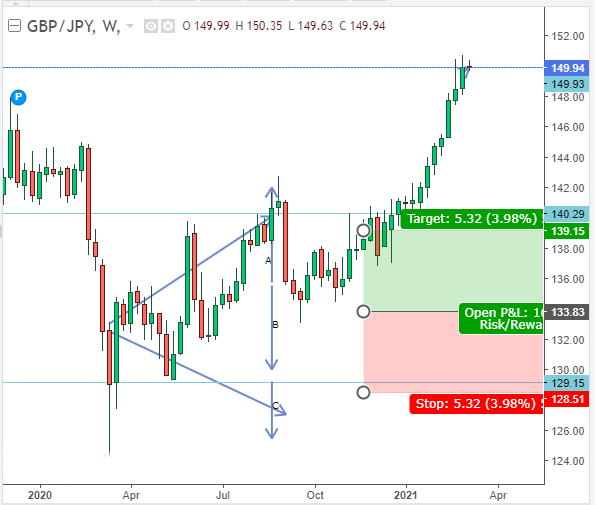
The trader must understand the dynamics around the projection of the price movement either on the upside or the downside. There are three sections that have been marked out in the midst of the wedge pattern. They are A, B, and C.

Figure 3: Price movement calculation
The trader should estimate or measure the difference of the price movement from point A to C. This difference will aid in forecasting the future price trend. Point A describes the upside target after prices cross the resistance level. The lowest point at C is 129.15, while point A meets at 140.29.
The percentage difference between these two regions is 3.98%. Calculate the difference between 140.29 and 129.15, which is equal to 11.14. Divide by point A, i.e., 140.29 to get 3.98%.
Prices rise at an average range of 3-30% from the upper resistance level. Point A shows that the lower trendline fell at 139.15. Here, the trader should target the upward price at a minimum of 3.98% before expecting a decline. Prices as of March 8, 2021, were 149.94, indicating that the average increase was 6.90%.
At point B, the trader sets the position to either acquire open profit or loss (P&L). For instance, in figure 3, the risk/reward target is 133.83. The trader here decides to either buy or sell based on the market sentiment. However, his position is guided by the two opposing sides, points A and C.
At point C, the trader will put the stop loss position. In figure 3, the stop loss is at 128.51. This means that if he had initiated a buy position when prices were at 133.83, the stop loss would prevent further decline should it go below the lower support line.
Conclusion
This article has described a step-by-step guide to using the broadening bottom in making a trading position. The article shows that correct identification of the pattern corresponds to a matching trading position. The trader should understand the price movement prior to the wedge formation and after it. In most instances, the breakout is upward. An upward breakout beyond the trendline (or resistance) gives new support, while a decline beyond the support gives a new resistance. The pattern makes way for a bullish reversal. The trader should understand where to initiate the buy, hold and sell position using the broadening bottom.


Leave a Reply