
A good investor knows all the tools crucial for profitable trades. However, one can only excel if one identifies the tools that work best. If you are looking for a tool that indicates when the market is about to turn a corner, you will like the head and shoulders pattern.
The big question here is how to apply the indicator best to obtain its maximum potential. Before addressing the question, it helps to understand the basics of the head and shoulders pattern, ways to identify the formation and interpret it best.
What does the head and shoulders pattern look like?
To be a trader means always watching the market and constantly making predictions of future price action. This means reading charts and spotting patterns that carry subtle hints as to what could happen next.
The head and shoulders formation on a price chart indicates a trend reversal. An upright pattern shows precisely where the market negotiates the corner from bullish to bearish trend; see figure 1 below.
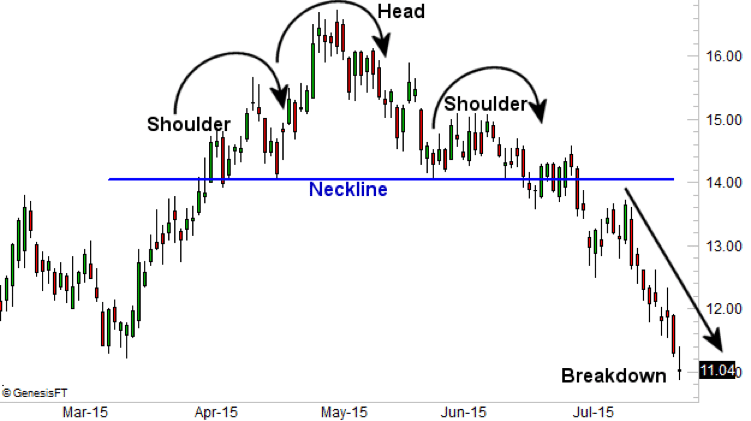
Figure 1: Head and Shoulders formation
Figure 1 shows two shoulders on either side of the head. A baseline, also called neckline, completes the pattern.
Left shoulder
The left shoulder is the first peak that forms when the price action takes a short-lived reversal after a considerable bullish run. During the reversal, the price action declines into a shallow trough, just touching the neckline.
Head
If the market recovers from the correction with a stronger momentum, the price will likely break above the previous peak or the left shoulder. After the sharp recovery, the markets may be corrected once again. This time, the market declines more sharply compared to the previous correction. The “head” is the highest high in the pattern.
Right shoulder
After the correction, the market may attempt another recovery for the second time. However, the buyers could be exhausted or unwilling to make large bets like last time. For this reason, the recovery is weaker than before, which leads to the formation of a peak shorter than the previous one. The lower high is the right shoulder.
Neckline
The head and shoulders formation has two troughs; the first one forms after the initial correction, and the second one comes after the last correction. In many cases, you can draw a horizontal line connecting the two troughs on either side of the head. If so, then what you have is the neckline. Some traders like to call it the baseline.
The head and shoulders bottom formation
Previously, we referred to the chart pattern in figure 1 as an “upright” head and shoulders pattern. This is because the pattern can form on the opposite side of the market, which traders refer to as head and shoulders bottom.
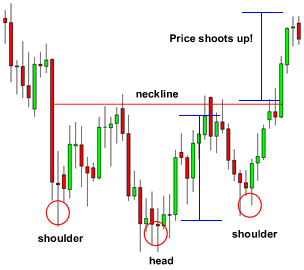
Figure 2: Head and Shoulders bottom pattern
Everything appears the same as before, the only difference being that the orientation of the inverse pattern is upside down. We now have valleys instead of peaks. The shallow valley on the left is the left shoulder, and the almost similar valley on the right is the right shoulder. In the middle is a deeper valley, which forms the head.
Techniques for trading the pattern
Knowledge of the indicator is incomplete without learning a couple of tricks to employ. Before we get to the techniques, it helps to know how to read the chart pattern.
In the first place, the pattern is complete when the price touches the neckline after forming the third shoulder. Some traders wait for the pattern to complete before confirming the signal. Secondly, traders expect the price to drop from the neckline after the pattern completes by the same margin as the one from the neckline to the head.
Trading the emerging pattern
The conventional wisdom counsels that one should wait for the pattern to complete before trading. This means the best time to open a trade is when the price action breaks below the neckline (in an upright head and shoulders pattern).
However, following conventional wisdom comes at a price. The price is missing out on potential gains if you had moved earlier or when the pattern was emerging.
Figure 3 shows an incomplete head and shoulders pattern, also called an emerging pattern. It’s uncertain whether the pattern will finish forming. However, a closer look at the RSI shows that sellers are stronger. This indicates the odds for the pattern to complete are more than 50%.
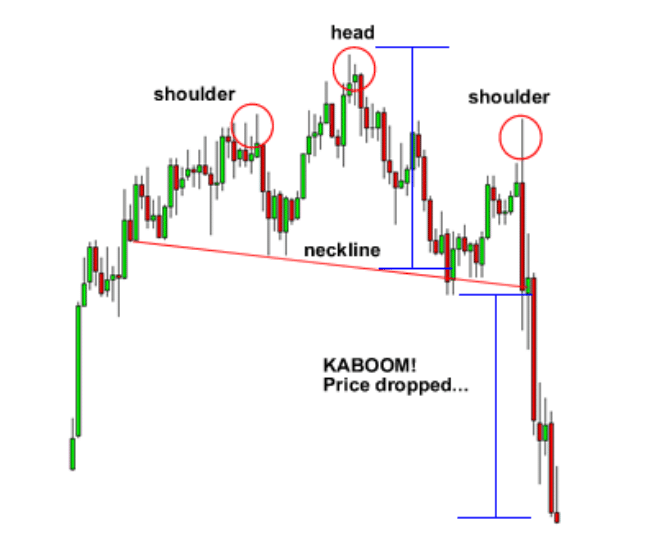
Figure 3: Emerging head and shoulders pattern
In figure 3, you risk missing out on $5 worth of profit (the difference between the current price, $69, and the price at the neckline, $64) if you choose to wait for the pattern to complete. In short, it is acceptable to use additional indicators, such as the RSI, to help anticipate pattern completion. This way, you will be able to beat the market.
Risk management
Head and shoulders pattern, as with any other indicator, requires traders to anticipate potential risks per your positions. It is unhelpful to be overconfident about one’s analysis. Always remember to use stop-loss orders to manage the downside risk of setups, such as in figure 3.
How to place your stops
In the case of the upright pattern, the ideal location for a stop-loss order is closer to the peak of the right shoulder. This stop is crucial, whether you are trading the incomplete pattern or waiting for the formation to complete. More daring traders choose the head’s peak (the price at the peak of the head) as the ideal stop-loss order price. However, the risk-reward ratio of such a move leans heavily on the risk side.
Closing thoughts
Trading is more about probabilities than certainties, but some useful techniques will help you avoid a number of mistakes. This means the setup you choose to trade does not guarantee returns. However, a great understanding of valuable tools such as the head and shoulders chart formation increases the chances of a profitable trade.


Leave a Reply