Renko charts are a trading utility that helps the trader to exploit the price trend for profit. The charts appear like bricks where a green or white brick represents an upwards price movement. On the contrary, a red box shows that the price is falling. Particularly, Renko charts have a smoothing effect; they do not focus on small price movements.
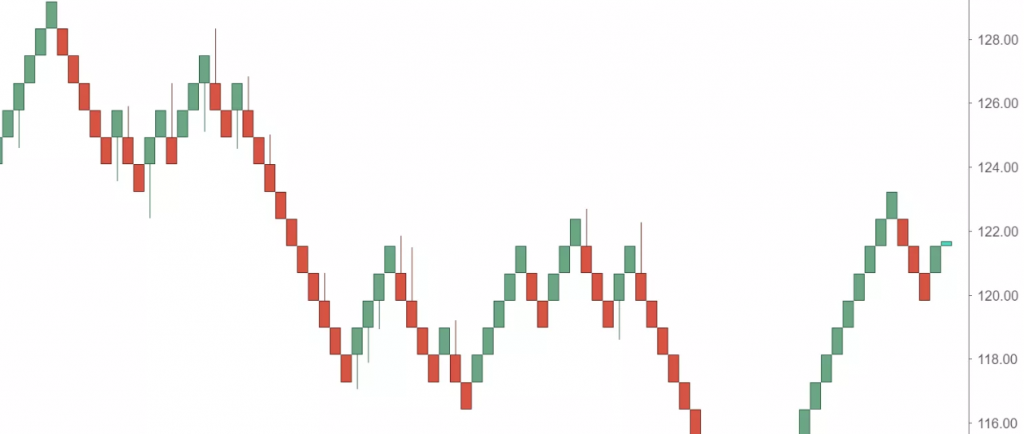
The indicator only focuses on price movements and nothing else. This means that a user of Renko charts may not see what effect other data has on the asset. Nonetheless, the sole focus on price movements ensures that the trader only follows significant trends. Trend trading is one of the best forex trading secrets that all great traders must learn. Simply, a trend refers to the general direction of an asset. For example, a forex pair is in an uptrend when the price increases from one session to the next for an extended period of time.
In a sense, Renko charts look like the normal candlestick charts. However, the bars in a Renko chart are of the same size. This is because each bar represents the same amount of price movement. For example, you can have one bar/brick represent 30 pips. This means that, for every 30-pip change in the currency pair, a new bar forms. If there is an increase of 30 pips, a green bar forms. A red bar will form if the price drops by 30 pips. One more thing, the bricks in a Renko chart do not form side-by-side like in a normal candlestick chart.
Why are Renko charts useful?
By focusing on the trend, and smoothing all other minor price movements, Renko charts are ideal for traders chasing big moves. Oftentimes, price movements reverse for a moment and then continue on the trend. Even if you are using the best forex indicators, you are likely to get jittery and get out of a trade position. Obviously, you will end up with a huge disappointment if the trade ends up higher.
Additionally, Renko charts forex are ideal for traders who struggle when it comes to picking profitable price targets. Each brick that forms tells a story of what the future looks like. This way, you can easily make up your mind about where to place the profit target. Also, this indicator is useful for traders who find it difficult to anticipate proper entry and exit points. By smoothing out the noise, one is able to see the big picture of the market. As such, entry points and exit points become clearer.
Building Renko charts
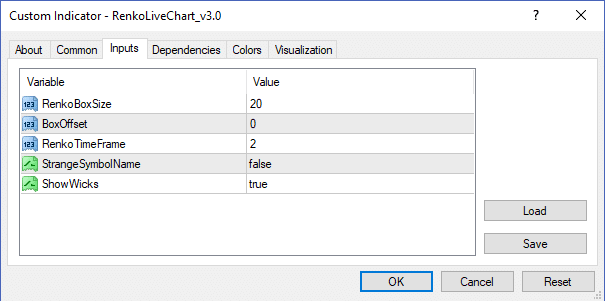
For MetaTrader users, one has to download the Renko charts before using them. Once the indicator is ready, you add it on a chart. Before adding it on the chart, you have to specify the inputs. The default inputs are 20 pips for the size of each brick while the timeframe is 2 minutes. This means that each brick forms using the closing price at every two minutes.
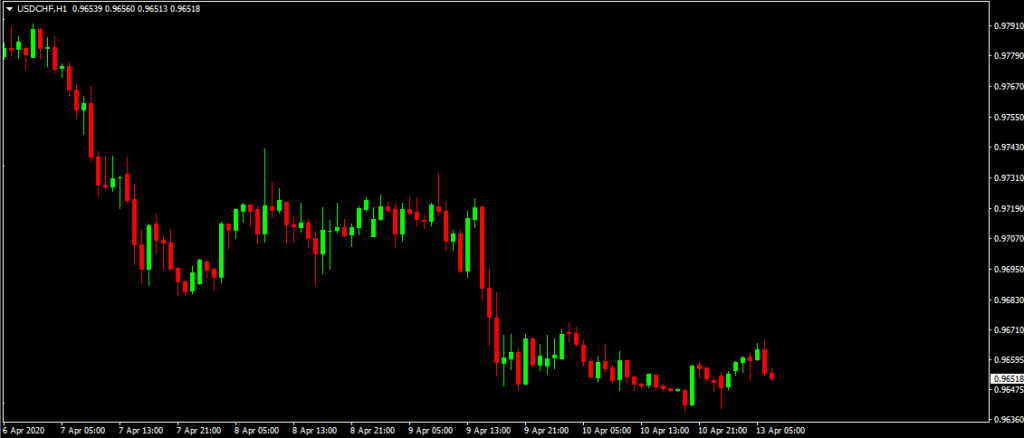
There is a big difference when you look at the Renko chart in comparison with the normal candlestick chart. The figures below show the USD/CHF chart. The first chart shows the normal candlestick chart.
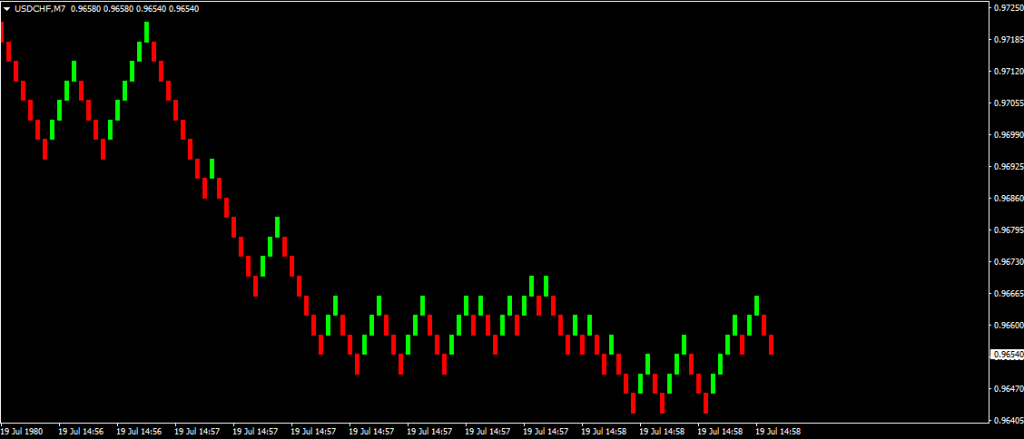
The second chart is the same currency pair but now, notice that the axis that shows time is insignificant. Also, notice that the Renko chart is smoother and easier to follow.
How to use Renko charts
For any trader, how to trade Renko charts successfully is all that matters. At first, it may seem like a steep learning curve but you will be surprised that is not the case. Important to note, you should know that Renko charts do not factor in the time aspect of the currency pair. What matters is the price movement. Also, you should understand why the bricks in the Renko charts pile after each other at a 45-degree angle. They pile like this because the next box forms only after the price moves the size of the previous box.
If the size of one brick is 20 pips, like in the figure above, a brick will not form until the USD/CHF pair moves by 20 pips in either direction. If the previous brick closed at 20 pips, the next brick will be green if the pair moves by another 20 pips. However, nothing will happen if the pair drops by 20 pips. A red box will form only when the pair drops by 40 pips that is 20 pips to cover the previous box and 20 pips to form a new bear box.
The best way to use Renko charts for successful trading is to combine them with other indicators like Ichimoku charts. The charts, also called equilibrium charts, will help you to identify the beginning of a trend or a turning point. Once locked, you can use the Renko chart to capture the trend as much as possible.




Leave a Reply