Price Action Trading Bar by Bar
Price action trading is a methodology for speculating the financial market that consists of the basic price movement analysis across time. Many retail traders, institutional traders, and hedge fund managers use price action trading to predict the future direction of the financial market quotes or security. To put it simply, price action is the action of an asset price. It displays how prices change. You can observe it most in markets with high liquidity and volatility, but anything bought or sold in a free market generates price action.
The bar-by-bar analysis is the most challenging part of price action trading. Traders have devised methods to make it easier that range from bar patterns to checklists. The bar-by-bar does not mean that all price bars are significant. So, you do not have to attribute some meaning to each of them. Now, you may wonder, why call it bar-by-bar analysis then? It is because it works on the concept that each bar can be crucial. This is why it is vital to pay attention to each price bar to understand if it is important.
You should not over-analyze because struggling to give some value and meaning to every price bar is not worth the effort, and it will only confuse you more. To analyze price action, all you need to do is figure out what is happening now to form expectations of the future as a base to evaluate what really happens so you can anticipate what will happen. The predictions may not always be impressive or right and that is fine.
Significant Price Levels For Every Bar/Candle
A bar itself displays the high, low, open, and close price for a given time period. These are crucial pivot points for day trader, that help to compare market sentiment against previous time day, week, or a month. So, there is a lot of information on the bar chart that investors and traders can utilize.
Long vertical bars show a big price difference that occurred between the high and low of that period. It means that during that period, volatility increased. On the contrary, when you see very small vertical bars, it indicates that there was little volatility.
If you see a huge distance between the open and close, it indicates a significant price move. If the previous bar close, high, or low breaks, this may be your trading signal. When the buyers are very active during a period and more buying in future periods is forthcoming, the levels can break, and a close would be far above the open. Similarly, when you notice that the close is nearby the open, there was little conviction in the price movement during the period, and there is no interest in trading this asset.
You can also derive valuable information from the location of the close relative to the low and high. If an asset rallied higher, but the close was so below the high, it shows that sellers came in toward the end of the period. It is less bullish than when the asset closes near its high for the period.
If it is a color-coded bar chart according to the rise and fall of the price, you can obtain information from the colors by taking a glance. Usually, green or black bars and strong upward price movements represent an overall uptrend. Similarly, red bars and strong downward price movements represent downtrends.
Volume and size of the movement is the key?
Analyzing charts bar by bar, the essential point is to look at the trading volume in a specific candlestick. For example, a key level breakout on a significant volume is an additional approval for the future price direction. While the big moves on a slight volume commonly end up with the reversal and false breakout.
It’s vital to have patience and wait until the bar closes to perform bar by bar analysis. Candlesticks like a hammer or reversal hammer on a high volume is usually a good setup for a reversal trade.
For efficient price action analysis practice, select a random part of the chart. Then, you may focus on analyzing a 20-bar section. You can offer an analytical context by using the most recent pivot high and low. Here are a few examples:
HD Daily Chart
Look at the daily price chart of Home Depot (NYSE: HD ) in this example.
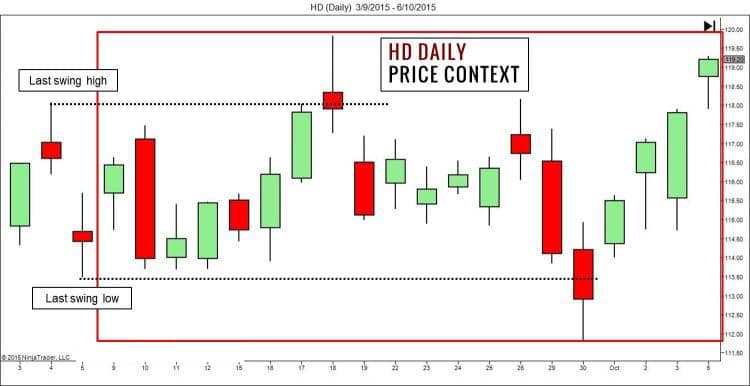
Price action context: You can see the 20 price bars that are selected. Two dotted lines mark out the most recent swing high and low exactly before the selected area.
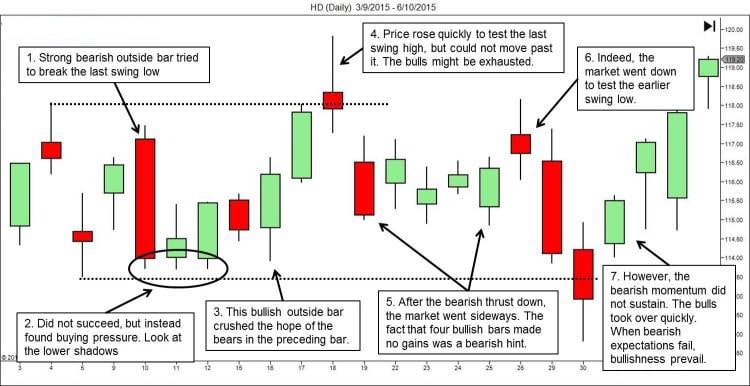
Bar-by-bar analysis: From the chart, this is the analysis we get –
- The heavy bearish outside bar tried to reach and break the last swing low.
- It did not succeed. Instead, the market found buying pressure.
- The bearish bar was a test to confirm whether the buying pressure would hold. The bullish outside bar confirmed the seriousness of the bulls.
- Price rose fast in a climatic way to test the last swing high, but the market could not move past it by clearing the resistance above.
- After the bearing thrust down, the market fell and went into a trading range. The consecutive bullish bars did not push the market upward.
- After that, the market went lower.
- However, it rebounded fast. Keep in mind that the bulls prevail when the bearish expectations fail.
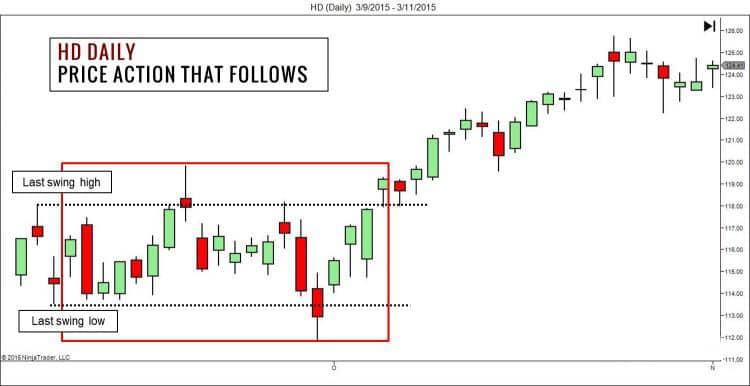
The following price action: Look at the chart below. The area we just analyzed is in the red box. Now, take a look at the price action that follows after that.
Crude Oil 3-Minute Chart
Now, we will view an intraday chart with 3-minute bars of crude oil futures:
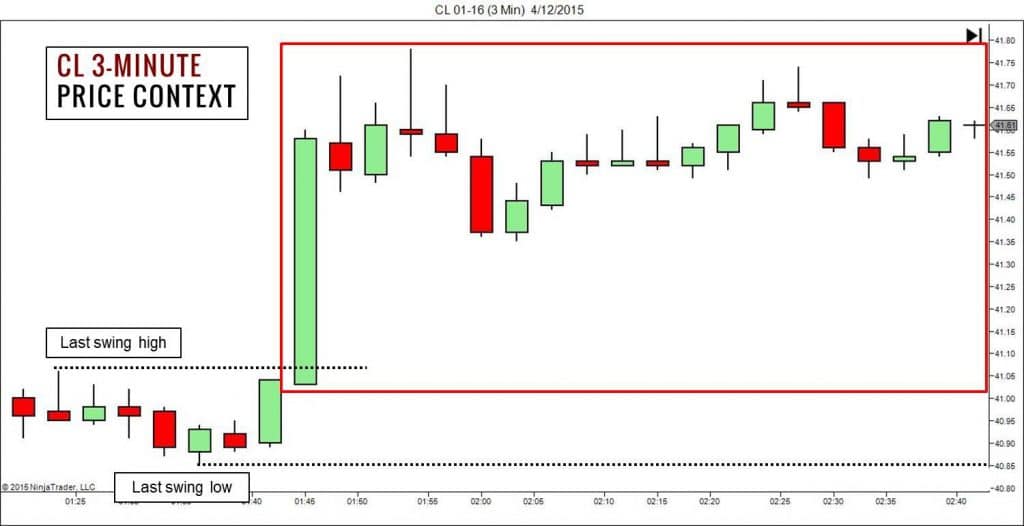
Price action context: We will analyze the 20 bars in the red box of the chart below. The dotted lines mark the most recent swing high and low just before the area we will analyze.
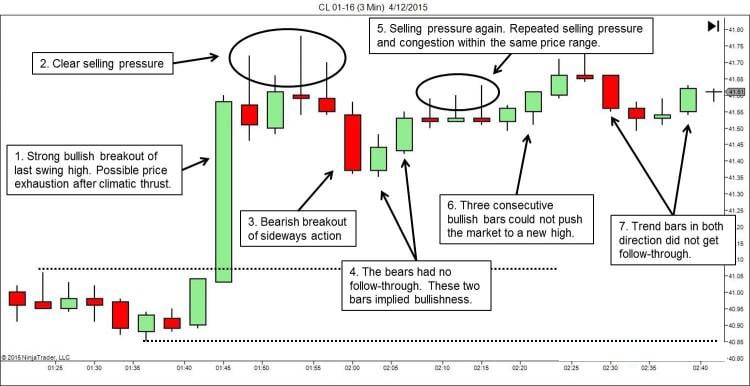
Bar-by-bar analysis: By analyzing the chart we see –
- The bar was a powerful break above the prior swing high. So, the bulls may be exhausted.
- Here, the selling pressure cemented the idea that the Bull Run may be over.
- The market makes the first real attempt to push lower.
- However, there is no follow-through of the bearish thrust. The two bullish bars implied that the control of the bulls remained.
- Here, the top shadows were significant. They display selling pressure within the same price range where you found the sellers earlier.
- The series of three bullish bars were not so bullish after all. The streak failed and made a new high where the last bar displayed a longer top shadow.
- The market did not commit to any direction.
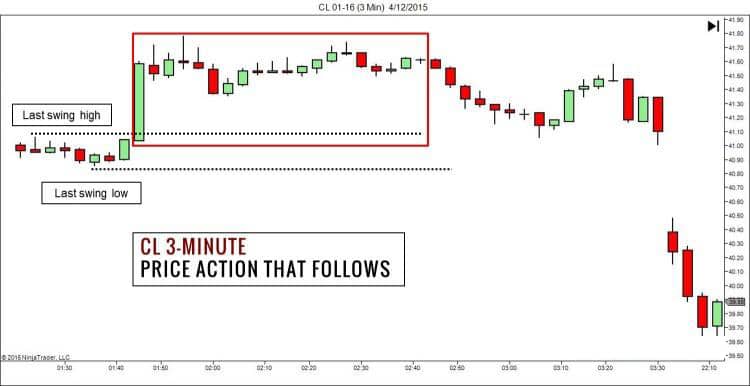
The following price action: Look at the bar below to see the price action after the area we analyzed in the red box.
The Advice
By paying attention to price, you can find great value; however, this a skill to develop. The best way to practice is to watch as many charts as possible to improve visual memory for trading. It will take some time, but you will notice familiar setups seen day by day in the result.


Leave a Reply