Trading Strategies: An Introduction
Trading the forex can be deemed as a daunting task as only a few are able to succeed. It is undoubtedly not a get rich scheme but is a mixture of constant struggles and efforts that includes managing your risk, psychology, and trading strategy. Those who begin their path in dtrading are sometimes let astray by the hundreds of ways/strategies. Some of the traders formulate their self-made plan to tackle the market by constant trial and error. A few blueprints are the choice of most, i.e., price action, range, swing, trend, position, day, automated, news, and scalping. Each trader has his taste when selecting a masterplan and may choose one based on their personality.
What Is the Price Action Strategy?
Price action traders involve analyzing the charts and making all trading decisions solely by reading the price. It is limited in the number of indicators employed, including the moving averages that may or may not help identify potential support or resistance and market trend. The data represented on a trading chart is a result of varying prices caused by economic releases, various news events, beliefs and actions of traders, etc. Price action traders say they don’t need to have a specific indicator to analyze these movements; instead, the charts are enough to formulate a trading plan and execute positions.
The strategy can be employed on many instruments, including equities, bonds, forex, commodities, derivatives, etc. Retail/professional traders, arbitrageurs, speculators, and many prop firms use price action as their primary trading strategy.
Key Components of Price Action
Any price action trader out there follows a general standard of rules specific for that particular instrument. Necessary charting tools and their uses are described as follows:
- Trend lines provide a good sense in determining the market fluctuations and potential support and resistance. Draw them on a Daily or H4 chart
- Market fluctuations are one of the essential components when it comes to analyzing where the market is moving. A higher-high with a higher low makes up for an uptrend, while a lower high and lower low means that the currency pair is depreciating. For swing traders, the structure or trend is known by looking at the daily chart, while day traders use H4 and H1. If the market breaks the previous higher low or lower high, it is referred to as a break of structure—most traders lookout for this, especially on lower time frames before entering a trade
- Monthly, Weekly and Daily time frames are the famous ones for drawing support and resistance lines. Key levels are also a major component in determining where the market may potentially have some strange attitude in price
- Supply and demand zones are the areas on a chart where you’ll see the price has approached many a time. They can act as valuable indicators on where a potential reversal may occur
- Candlestick patterns like bullish or bearish engulfing are also sometimes included in price action trading. Dojis, shooting stars, hammers, etc., are some noted shapes.
Analysis of Price Action From Weekly to M15
For the sake of our convenience, we choose a different color for every time frame we analyze. Weekly is set as black, red for daily, and green as H4. Breaking it down from the higher to lower time frames will help us understand what price action is. Some may prefer trading solely of a single chart such as H1. However, using multiple of these can surely increase the probability of win/loss ratio and better determine our positions’ entry/exit points.
Multiple confirmations are also helpful in increasing the win rate in our favor. It is beneficial in maintaining consistency in trades. Generally, two or three are enough to get into a position, but more are also welcomed. Let us look at some examples of how one can break down price action starting from the weekly up to M15.
Symbol
EUR/USD
Confirmations:
- Daily key level and Bearish candle
- The market structure on Daily and H4
- Supply zone
Trade Type: trend
Trade execution time:
R/R 1:2
Result: Win
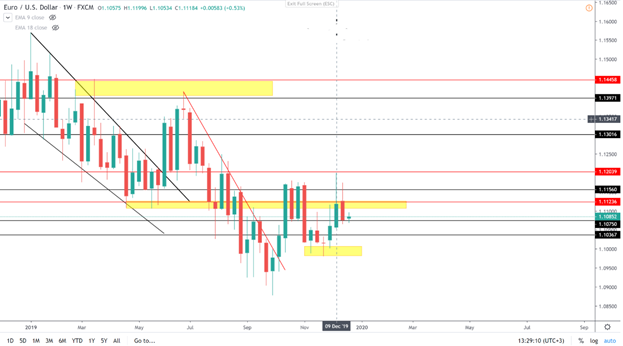
Weekly
Here we have a weekly chart from a traditional price action trader. Various markings of weekly key levels, daily key levels, trend lines, etc., can be seen alongside a few significant supply and demand zones highlighted in yellow. No confirmations were available on this time frame for our trade, so we’ll skip to daily.
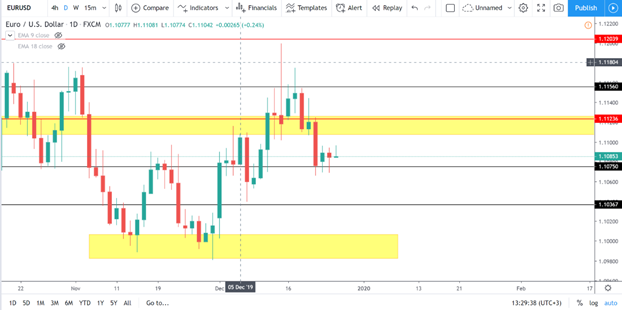
Daily
We can see a strong rejection of the previous daily candle on the chart, which is also a bearish pin bar. The supply zone and the daily key level indicate that the area is cluttered with sellers and the market cannot break it. The daily trend is also bearish, with the price making lower lows and lower highs.
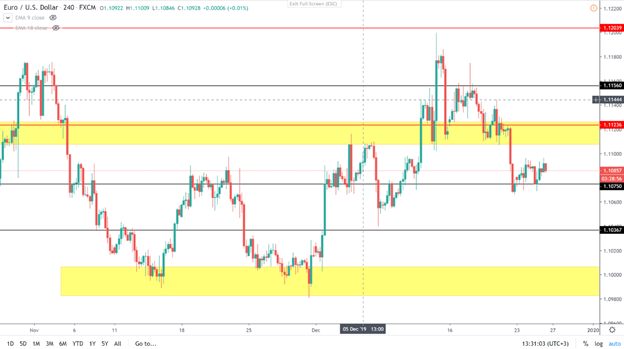
H4
On the H4, we can still see the same bearish pattern similar to the daily with the markets in a downtrend. We also had additional confirmation from the bearish engulfing candlestick pattern. The price also has touched the tip of the sell zone. Most day traders would take an entry straight of the engulfing pattern, but some may go to even lower time frames to get the perfect entry.
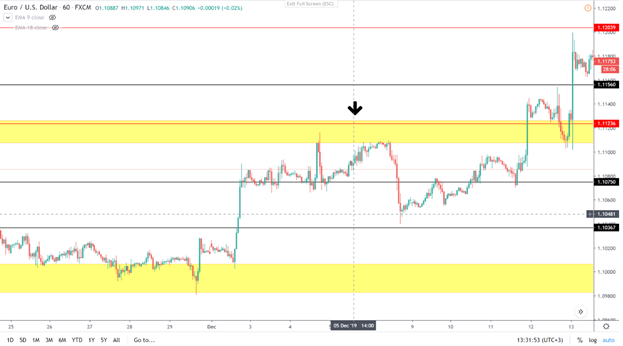
H1
On the H1 chart, we are looking for simple things to get into our sell position. It boils down to personal preference as some may enter the trade as soon as they start seeing many bearish candles on lower time frames.
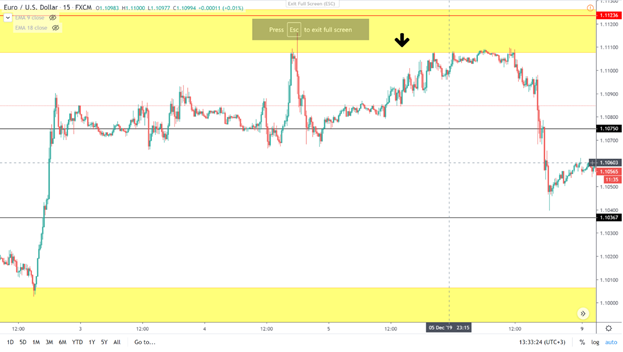
M15
The 15-minute chart can provide accurate sniper entries. The theme here is to wait for the market to break structure on the lower time frame, come back, and re-test with a bearish engulfing pattern, and there is your entry. Moving average crossover is also favored in some cases.
End of the Line
Price action trading can give one good monthly returns if mastered perfectly with psychology and proper risk management. The basic idea behind the strategy is the same, i.e., reading the charts. Some theories may suggest hefty profits on their plans, but one should not ignore that only successful stories make their way to wall street.


Leave a Reply